Technical Analysis of SCHF 2024-05-31
Overview:
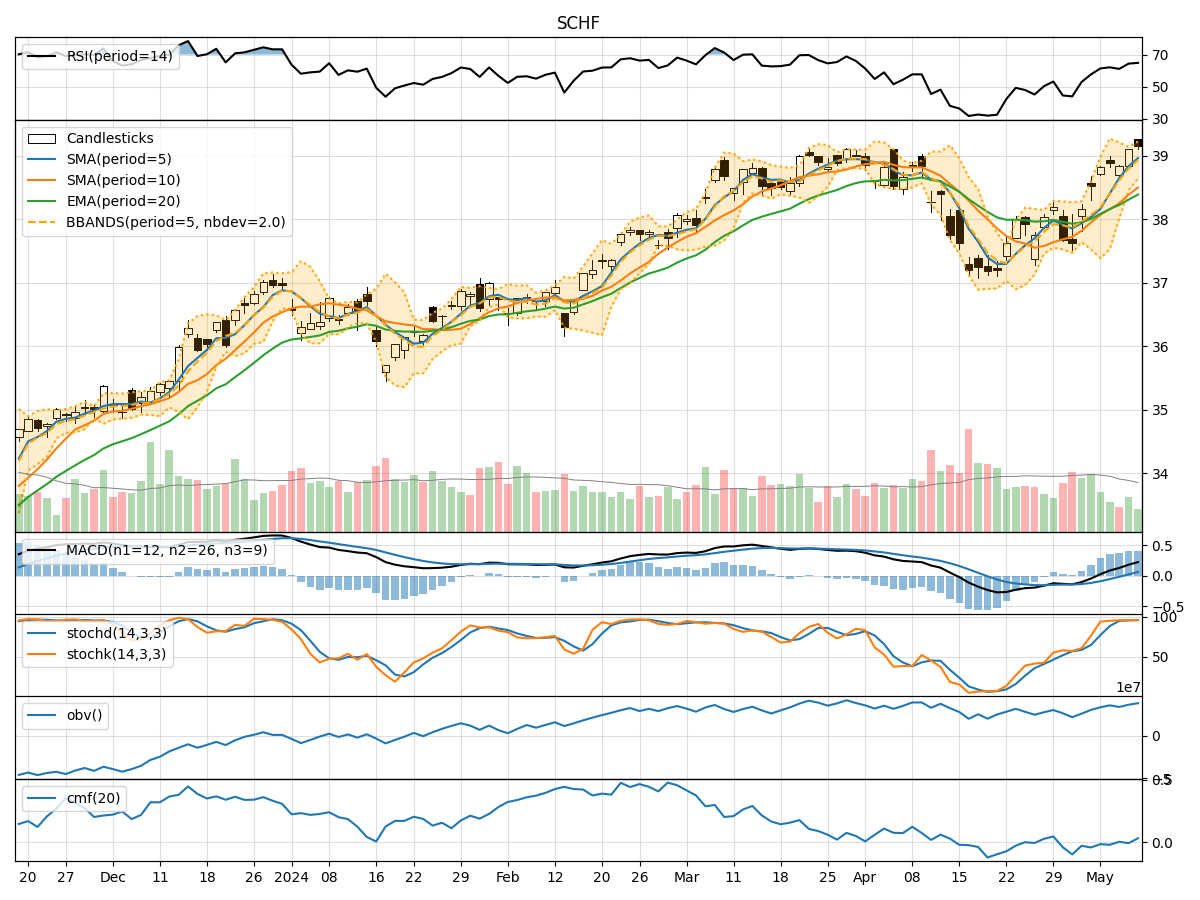
In analyzing the technical indicators for SCHF over the last 5 days, we will delve into the trend, momentum, volatility, and volume indicators to provide a comprehensive outlook on the possible stock price movement in the coming days. By examining these key aspects, we aim to offer valuable insights and recommendations for potential investors.
Trend Indicators:
- Moving Averages (MA): The 5-day MA has been fluctuating around the closing prices, indicating short-term price trends. The SMA(10) and EMA(20) have shown slight variations but have not diverged significantly.
- MACD: The MACD line has been hovering around the signal line, suggesting a lack of strong momentum in either direction.
- MACD Histogram: The histogram has been oscillating around the zero line, indicating a balanced market sentiment.
Momentum Indicators:
- RSI: The RSI values have been fluctuating around the mid-level, indicating a neutral momentum in the stock.
- Stochastic Oscillator: Both %K and %D values have been relatively low, suggesting a potential oversold condition.
- Williams %R: The Williams %R values have been fluctuating, but the recent readings indicate a potential oversold condition.
Volatility Indicators:
- Bollinger Bands: The stock price has been trading within the Bollinger Bands, with no significant breaches indicating stable price movements.
- Bollinger %B: The %B values have been hovering around the mid-level, suggesting a balanced volatility.
- Bollinger Band Width: The band width has remained relatively stable, indicating consistent volatility levels.
Volume Indicators:
- On-Balance Volume (OBV): The OBV values have shown mixed trends, reflecting indecision among market participants.
- Chaikin Money Flow (CMF): The CMF values have been positive but not significantly high, indicating moderate buying pressure.
Conclusion:
Based on the analysis of the technical indicators, the stock price of SCHF is likely to experience sideways movement in the coming days. The lack of strong trends in the moving averages, neutral momentum signals, stable volatility levels, and mixed volume indicators suggest a period of consolidation. Investors may expect the stock price to trade within a narrow range without a clear directional bias. It is advisable to closely monitor key support and resistance levels for potential breakout opportunities.