Technical Analysis of AAA 2024-05-10
Overview:
In analyzing the technical indicators for AAA stock over the last 5 days, we will delve into the trend, momentum, volatility, and volume indicators to provide a comprehensive outlook on the possible stock price movement in the coming days. By examining key metrics such as moving averages, MACD, RSI, Bollinger Bands, and OBV, we aim to offer valuable insights and predictions for informed decision-making.
Trend Analysis:
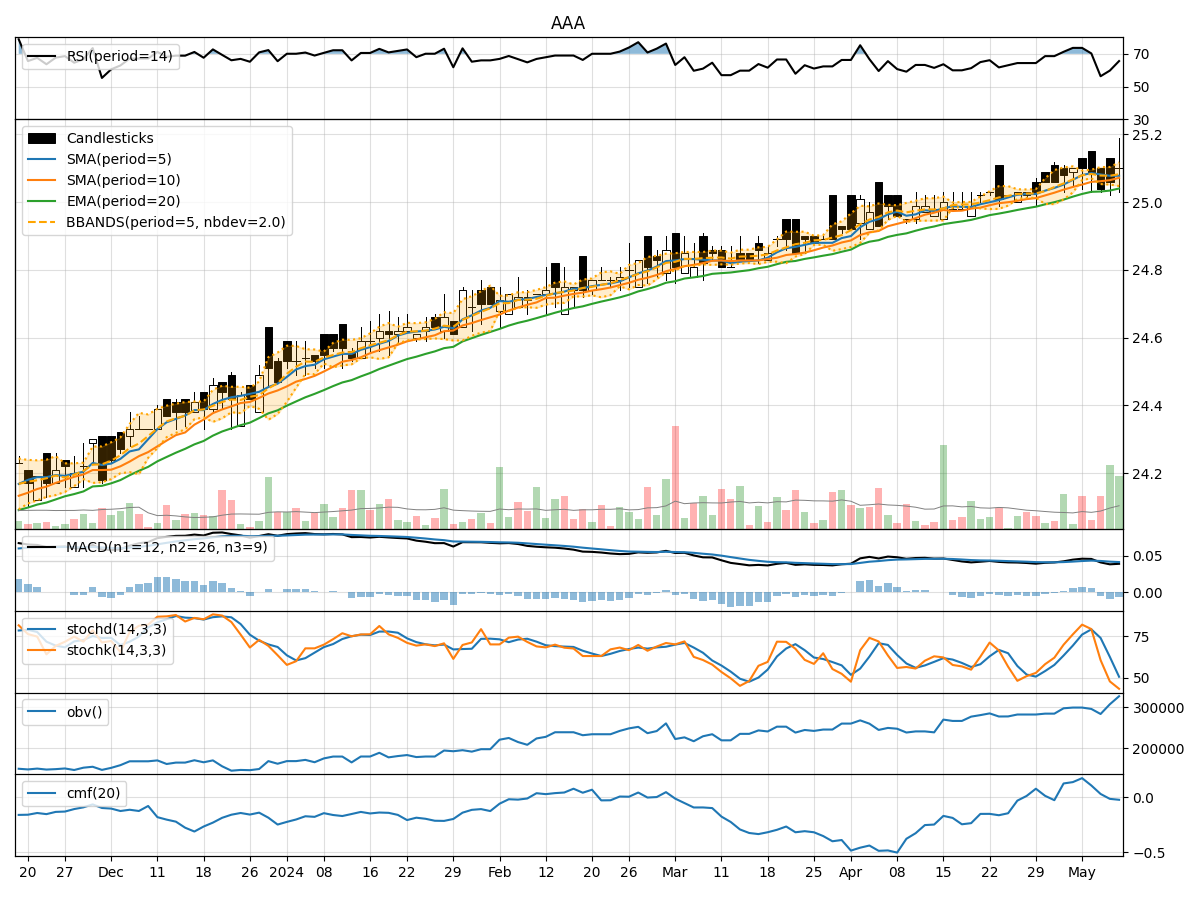
- Moving Averages (MA): The 5-day moving average has been relatively stable around the closing prices, indicating a consistent trend.
- MACD: The MACD line has shown slight fluctuations but has generally remained close to the signal line, suggesting a balanced momentum.
- EMA: The exponential moving average has been gradually increasing, reflecting a positive trend in the stock price.
Momentum Analysis:
- RSI: The Relative Strength Index has fluctuated within the neutral range, indicating a lack of strong buying or selling pressure.
- Stochastic Oscillator: Both %K and %D have been declining, signaling a potential bearish momentum.
- Williams %R: The Williams %R has moved from oversold to neutral levels, suggesting a possible reversal in the short term.
Volatility Analysis:
- Bollinger Bands: The Bollinger Bands have narrowed, indicating decreased volatility and a potential period of consolidation.
- Bollinger Band %B: The %B indicator has hovered around the middle range, reflecting a balanced market sentiment.
Volume Analysis:
- On-Balance Volume (OBV): The OBV has shown mixed signals, with fluctuations in volume accumulation, indicating indecision among market participants.
- Chaikin Money Flow (CMF): The CMF has been negative, suggesting selling pressure and a bearish sentiment in the market.
Key Observations:
- The stock is currently in a consolidation phase, as indicated by the narrowing Bollinger Bands and mixed volume indicators.
- Momentum is showing signs of weakness, with the Stochastic Oscillator pointing towards a potential bearish trend.
- The RSI and Williams %R suggest a neutral to slightly bearish sentiment among traders.
Conclusion:
Based on the analysis of the technical indicators, the next few days for AAA stock are likely to see sideways movement with a slight bearish bias. Traders should exercise caution and consider waiting for clearer signals before making significant trading decisions. It is advisable to monitor key support and resistance levels closely to gauge the stock's direction accurately.