Technical Analysis of AMZU 2024-05-10
Overview:
In analyzing the technical indicators for AMZU over the last 5 days, we will delve into the trend, momentum, volatility, and volume indicators to provide a comprehensive outlook on the possible stock price movement in the coming days. By examining these key aspects, we aim to offer valuable insights and predictions to guide investment decisions.
Trend Indicators:
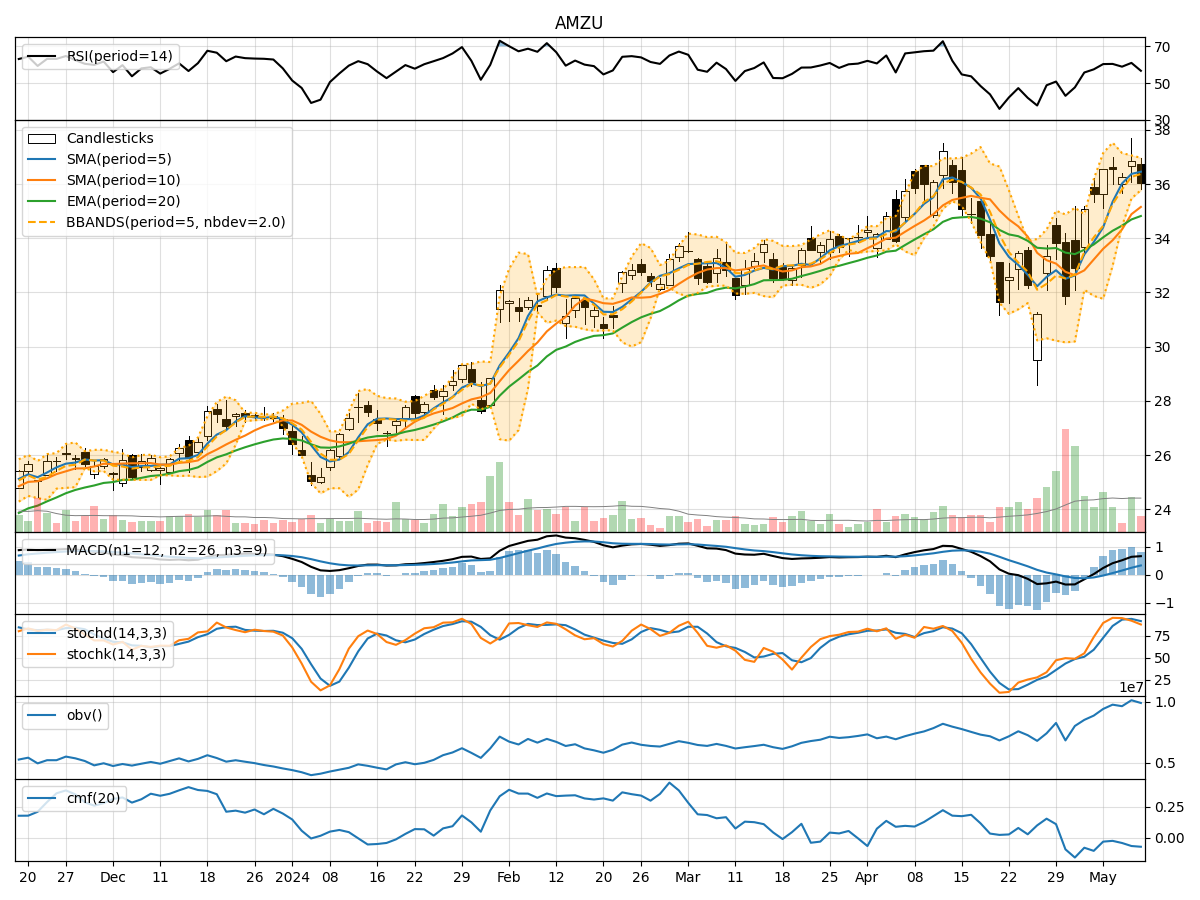
- Moving Averages (MA): The 5-day MA has been consistently above the 10-day SMA, indicating a short-term bullish trend. The EMA(20) has shown a gradual uptrend, suggesting positive momentum.
- MACD: The MACD line has been above the signal line, reflecting bullish momentum. The MACD histogram has been increasing, indicating strengthening bullish momentum.
Momentum Indicators:
- RSI: The RSI has been fluctuating around the 60 level, indicating a neutral stance with no extreme overbought or oversold conditions.
- Stochastic Oscillator: Both %K and %D have been relatively high, suggesting bullish momentum. However, %D is approaching overbought levels, signaling a potential reversal.
Volatility Indicators:
- Bollinger Bands (BB): The stock price has been trading within the bands, with the %B indicator hovering around the midline. This indicates a period of consolidation and potential for a breakout.
- Average True Range (ATR): The ATR has shown relatively stable volatility levels over the past few days, indicating a lack of significant price fluctuations.
Volume Indicators:
- On-Balance Volume (OBV): The OBV has been fluctuating without a clear trend, suggesting indecision among market participants.
- Chaikin Money Flow (CMF): The CMF has been negative, indicating selling pressure and potential bearish sentiment in the market.
Key Observations:
- The trend indicators suggest a bullish bias in the short term, supported by moving averages and MACD.
- Momentum indicators show a neutral stance with a slight bullish bias, but the stochastic oscillator signals a potential overbought scenario.
- Volatility indicators point towards a period of consolidation, with the potential for a breakout in either direction.
- Volume indicators reflect indecision and a lack of strong buying or selling pressure.
Conclusion:
Based on the analysis of the technical indicators, the next few days for AMZU could see sideways consolidation with a slight bullish bias. Traders should monitor the stochastic oscillator for potential overbought conditions and watch for a breakout from the Bollinger Bands for a clearer directional signal. It is essential to remain cautious and wait for confirmation from multiple indicators before making significant trading decisions.