Technical Analysis of ARKX 2024-05-10
Overview:
In analyzing the technical indicators for ARKX over the last 5 days, we will delve into the trend, momentum, volatility, and volume indicators to provide a comprehensive outlook on the possible stock price movement in the coming days. By examining these key aspects, we aim to offer valuable insights and recommendations for potential investors.
Trend Analysis:
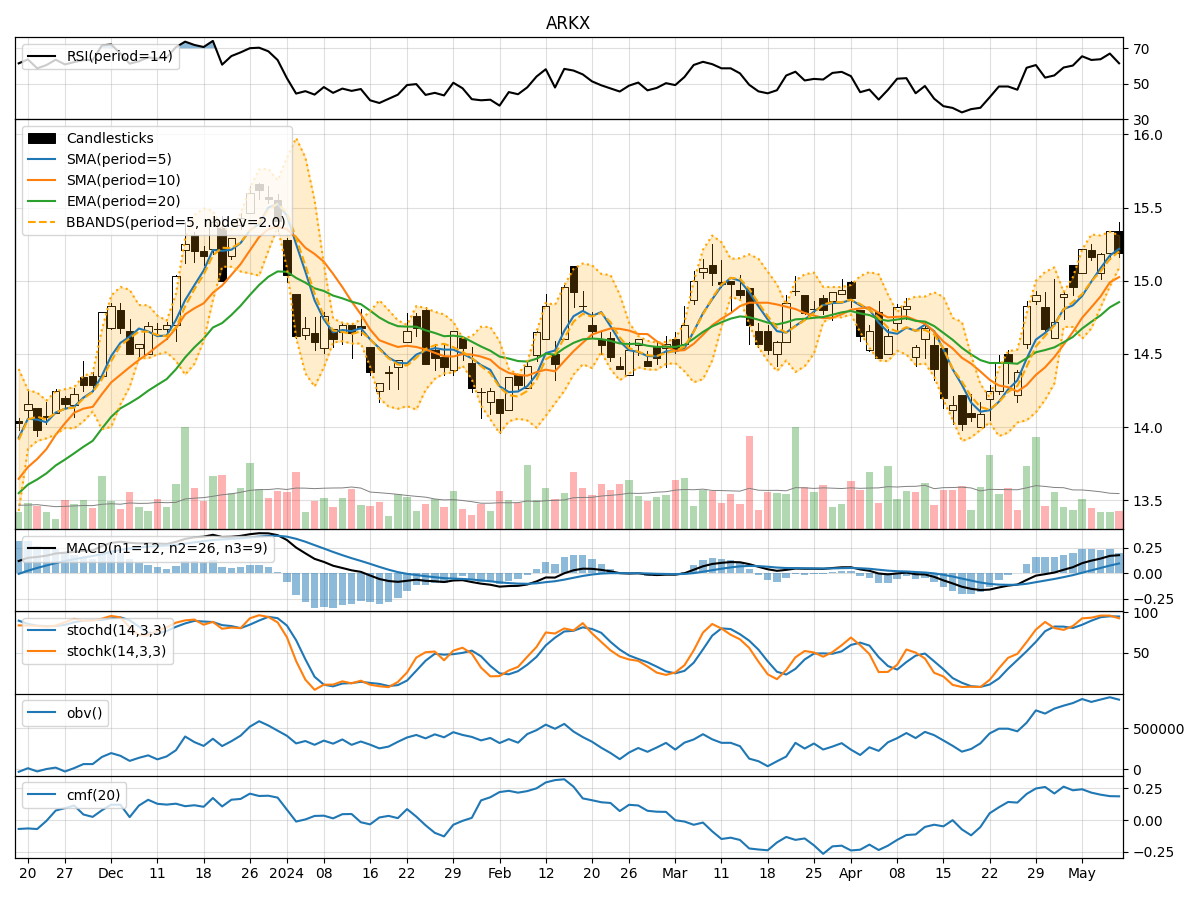
- Moving Averages (MA): The 5-day Moving Average (MA) has been consistently above the Simple Moving Average (SMA) and Exponential Moving Average (EMA), indicating a bullish trend.
- MACD: The MACD line has been consistently above the signal line, with both lines showing an upward trend, suggesting bullish momentum.
- RSI: The Relative Strength Index (RSI) has been fluctuating but generally staying within the neutral to slightly overbought territory, indicating a balanced market sentiment.
Momentum Analysis:
- Stochastic Oscillator: The Stochastic Oscillator has been fluctuating but generally staying in the overbought region, suggesting potential for a pullback.
- Williams %R: The Williams %R indicator has been fluctuating in the oversold region, indicating a potential reversal in the short term.
Volatility Analysis:
- Bollinger Bands: The Bollinger Bands have been narrowing, indicating decreasing volatility and a possible period of consolidation.
- Volatility Indicators: The volatility indicators show a decreasing trend, suggesting a stabilization in price movements.
Volume Analysis:
- On-Balance Volume (OBV): The OBV has been fluctuating but generally showing an increasing trend, indicating accumulation by investors.
- Chaikin Money Flow (CMF): The CMF has been positive, indicating buying pressure in the market.
Conclusion:
Based on the analysis of the technical indicators, the stock of ARKX is likely to experience sideways movement in the coming days. The bullish trend indicated by moving averages and MACD suggests a potential for upward movement, while the overbought conditions in momentum indicators and narrowing Bollinger Bands point towards a possible consolidation phase. The increasing OBV and positive CMF signal underlying strength in the stock. Therefore, it is recommended to hold positions in ARKX for now, closely monitoring the indicators for any signs of a breakout or reversal.