Technical Analysis of ASET 2024-05-31
Overview:
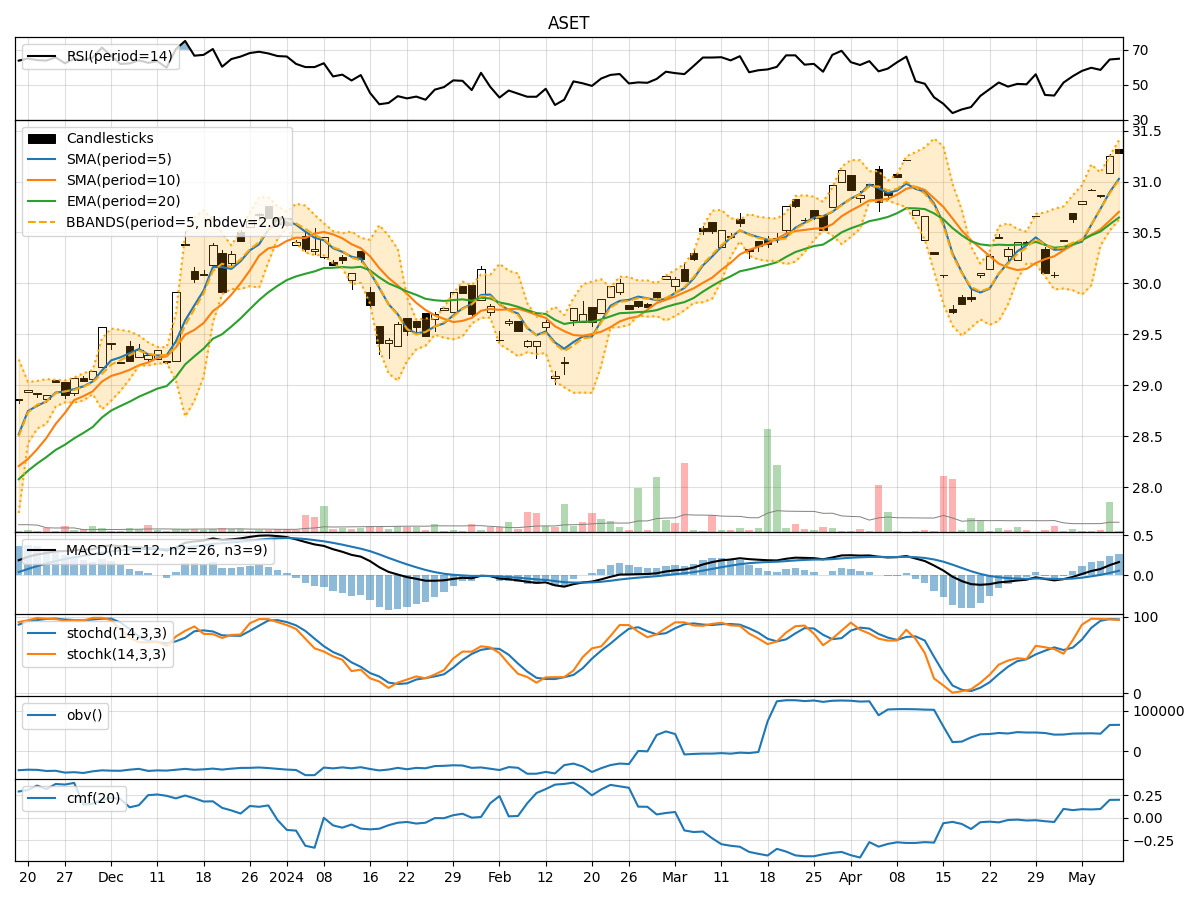
In the last 5 trading days, the stock price has shown some fluctuations with a slight downward trend. Various technical indicators such as Moving Averages, MACD, RSI, Stochastic Oscillator, Bollinger Bands, and Volume indicators provide insights into the stock's potential future movements. Let's analyze each category of indicators to determine the possible next few days' stock price movement.
Trend Indicators Analysis:
- Moving Averages (MA): The 5-day MA has been consistently below the closing price, indicating a short-term bearish trend.
- MACD: The MACD line has been below the signal line, suggesting a bearish momentum.
- EMA: The EMA has been declining, reflecting a weakening trend.
Key Observation: The trend indicators point towards a downward trend in the stock price.
Momentum Indicators Analysis:
- RSI: The RSI has been fluctuating around the 50 level, indicating indecision in the market.
- Stochastic Oscillator: Both %K and %D have been relatively low, suggesting a lack of strong momentum.
- Williams %R: The Williams %R is in oversold territory, indicating a potential reversal.
Key Observation: The momentum indicators suggest a sideways movement or a potential reversal in the stock price.
Volatility Indicators Analysis:
- Bollinger Bands (BB): The stock price has been trading within the bands, indicating normal volatility.
- BB Width: The width of the bands has been relatively stable, suggesting consistent volatility levels.
Key Observation: Volatility indicators imply a stable price movement with no significant deviations.
Volume Indicators Analysis:
- On-Balance Volume (OBV): The OBV has been relatively flat, indicating balanced buying and selling pressure.
- Chaikin Money Flow (CMF): The CMF has been positive, suggesting money flow into the stock.
Key Observation: Volume indicators show neutral sentiment with no clear direction.
Conclusion:
Based on the analysis of trend, momentum, volatility, and volume indicators, the stock is likely to experience sideways movement in the next few days. The trend indicators signal a downward bias, while momentum indicators suggest a potential reversal or consolidation. Volatility indicators indicate stable price movements, and volume indicators show a balanced market sentiment.
Overall View: The stock is expected to consolidate in the near term with a potential for a sideways movement. Traders should exercise caution and wait for clearer signals before taking any significant positions.