Technical Analysis of BBJP 2024-05-10
Overview:
In analyzing the technical indicators for BBJP stock over the last 5 days, we will delve into the trend, momentum, volatility, and volume indicators to provide a comprehensive outlook on the possible stock price movement in the coming days. By examining these key indicators, we aim to offer valuable insights and recommendations for potential investors.
Trend Analysis:
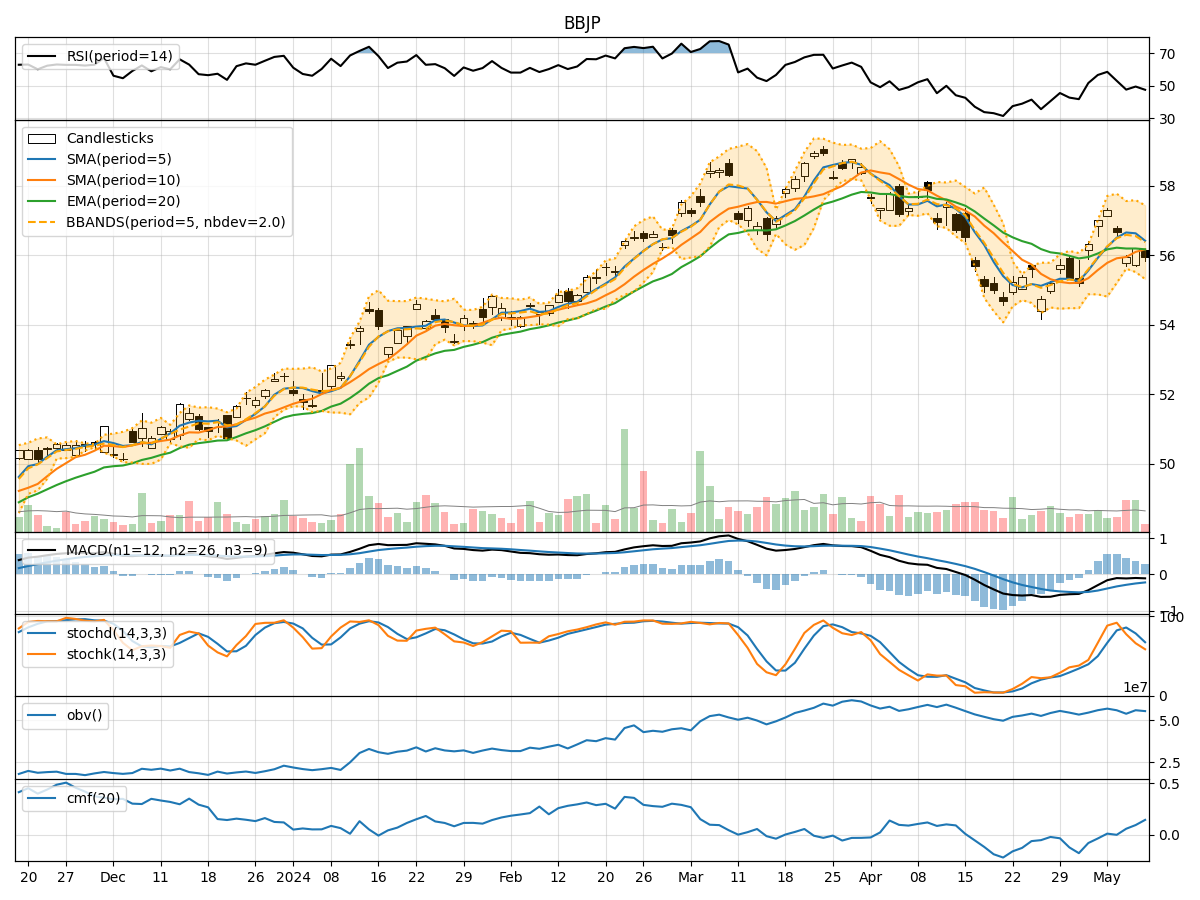
- Moving Averages (MA): The 5-day Moving Average (MA) has been fluctuating around the closing prices, indicating short-term price trends. The Simple Moving Average (SMA) and Exponential Moving Average (EMA) show a slight downward trend, suggesting a bearish sentiment.
- MACD: The Moving Average Convergence Divergence (MACD) has been negative, with the MACD line consistently below the signal line. This indicates a bearish momentum in the stock price.
- Conclusion: The trend indicators suggest a bearish outlook for BBJP stock in the near term.
Momentum Analysis:
- RSI: The Relative Strength Index (RSI) has been declining, indicating weakening momentum in the stock price movement.
- Stochastic Oscillator: Both %K and %D values have been decreasing, suggesting a potential downtrend in the stock price.
- Williams %R: The Williams %R is in the oversold territory, indicating a possible reversal or consolidation.
- Conclusion: The momentum indicators point towards a bearish momentum for BBJP stock.
Volatility Analysis:
- Bollinger Bands (BB): The Bollinger Bands show a narrowing range, indicating decreasing volatility in the stock price.
- Conclusion: The volatility indicators suggest a low volatility environment for BBJP stock.
Volume Analysis:
- On-Balance Volume (OBV): The OBV has been fluctuating, indicating mixed buying and selling pressure.
- Chaikin Money Flow (CMF): The CMF has been positive, suggesting a potential inflow of money into the stock.
- Conclusion: The volume indicators show a neutral stance with no clear direction in buying or selling pressure.
Overall Conclusion:
Based on the analysis of trend, momentum, volatility, and volume indicators, the overall outlook for BBJP stock in the next few days is bearish. The trend indicators, momentum signals, and the lack of significant volatility or volume movements all point towards a potential downward movement in the stock price. Investors should exercise caution and consider waiting for more positive signals before making any buying decisions.
Recommendation:
Given the current technical analysis, it is advisable to avoid buying BBJP stock in the short term. Traders may consider short-selling or waiting for more favorable indicators before considering a long position. It is essential to monitor the stock closely for any potential reversals or shifts in market sentiment before making any investment decisions.