Technical Analysis of BITX 2024-05-03
Overview:
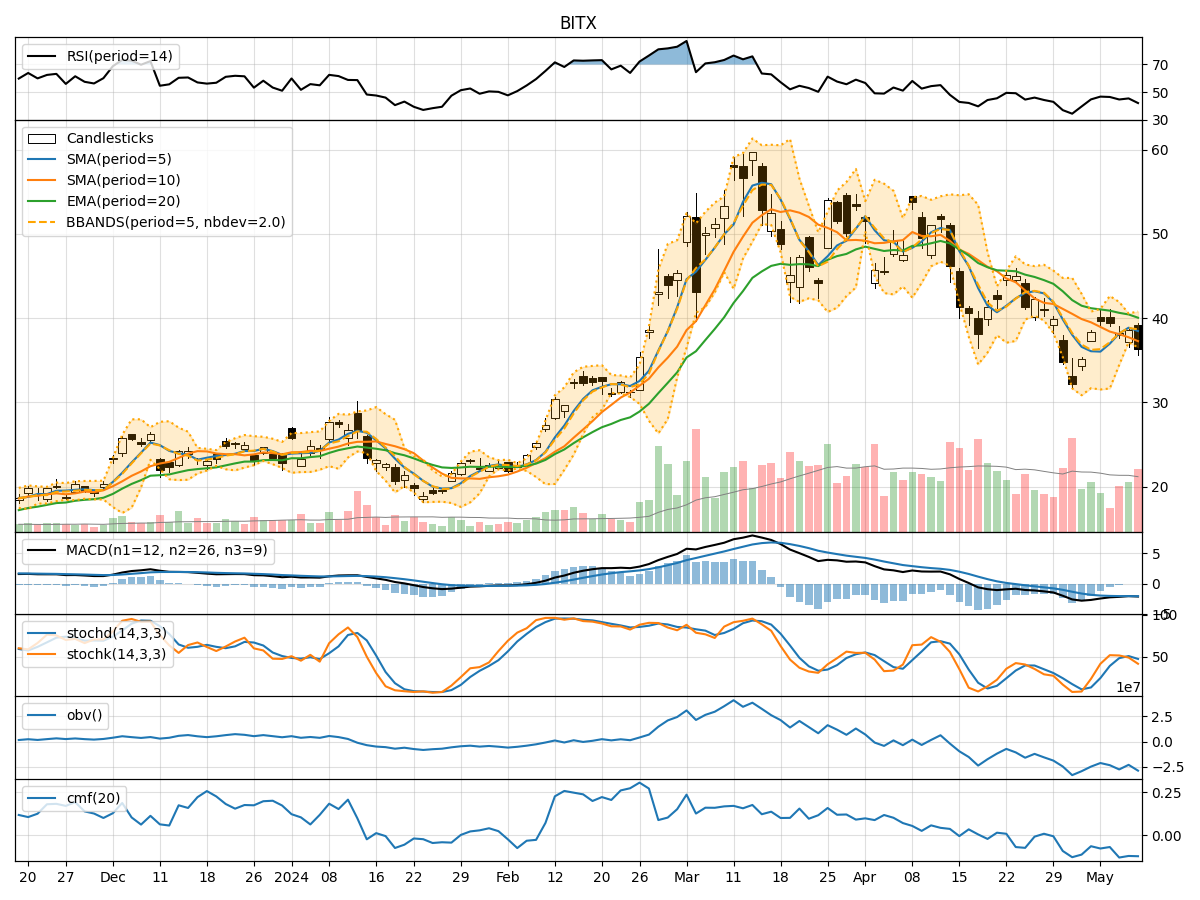
In the last 5 trading days, BITX stock has shown a downward trend in price, accompanied by decreasing volume. The moving averages and MACD indicators also reflect this bearish sentiment. Momentum indicators like RSI and Stochastic oscillators indicate oversold conditions. Volatility has been decreasing, and volume indicators show a consistent decline in buying pressure.
Trend Indicators Analysis:
- Moving Averages (MA): The 5-day MA has been consistently below the longer-term SMAs and EMAs, indicating a bearish trend.
- MACD: The MACD line has been below the signal line, with negative values, signaling a bearish momentum.
Momentum Indicators Analysis:
- RSI: The RSI has been below 50, indicating bearish momentum and oversold conditions.
- Stochastic Oscillators: Both %K and %D have been in oversold territory, suggesting a potential reversal or consolidation.
Volatility Indicators Analysis:
- Bollinger Bands (BB): The narrowing of the bands indicates decreasing volatility, which could precede a period of consolidation.
Volume Indicators Analysis:
- On-Balance Volume (OBV): The declining OBV suggests a lack of buying interest and potential distribution.
- Chaikin Money Flow (CMF): The negative CMF indicates selling pressure and bearish sentiment.
Key Observations:
- The stock is in a downtrend based on moving averages and MACD.
- Momentum indicators suggest the stock is oversold and may see a reversal.
- Volatility is decreasing, indicating a potential period of consolidation.
- Volume indicators show a decline in buying pressure, signaling weakness in the stock.
Conclusion:
Based on the technical indicators and analysis: - The stock is likely to experience a short-term consolidation or sideways movement before a potential reversal. - There is a possibility of a bullish reversal in the near future, supported by oversold conditions and decreasing selling pressure. - Traders should watch for confirmation signals such as a bullish crossover in MACD or RSI moving above 50 to consider long positions. - Caution is advised as the overall trend remains bearish, and a sustained upward movement would require strong buying interest and volume confirmation.
Recommendation:
- Short-term traders may consider buying on dips for a potential quick turnaround.
- Long-term investors should wait for more confirmation of a trend reversal before considering new positions.
- Monitoring key levels such as the 5-day MA and RSI crossing 50 will be crucial for decision-making.
In summary, while the stock shows signs of a potential reversal, it is essential to exercise caution and wait for further confirmation before taking significant trading actions.