Technical Analysis of BRZU 2024-05-10
Overview:
In analyzing the technical indicators for BRZU over the last 5 days, we will delve into the trend, momentum, volatility, and volume indicators to provide a comprehensive outlook on the possible stock price movement in the coming days.
Trend Analysis:
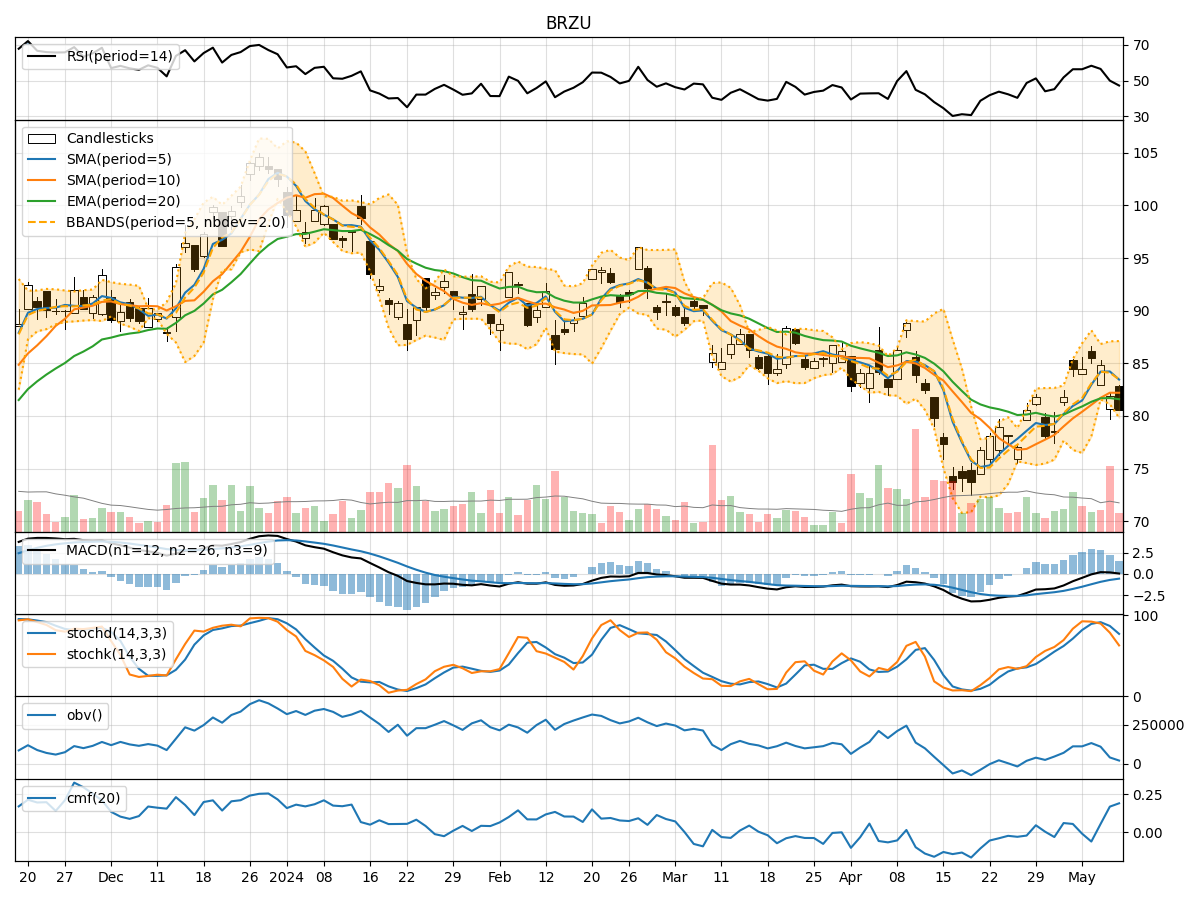
- Moving Averages (MA): The 5-day Moving Average (MA) has been fluctuating around the 80-85 range, indicating some volatility in the stock price.
- MACD: The Moving Average Convergence Divergence (MACD) has shown a slight positive trend, with the MACD line crossing above the signal line on some days.
- RSI: The Relative Strength Index (RSI) has been oscillating between 50-60, suggesting a neutral sentiment in the market.
Key Observation: The trend indicators show a mixed signal with some positive momentum but overall lack of a clear trend direction.
Momentum Analysis:
- Stochastic Oscillator: The Stochastic Oscillator has been declining, indicating a potential bearish momentum in the stock.
- Williams %R: The Williams %R is in the oversold territory, suggesting a possible reversal in the stock price.
Key Observation: Momentum indicators point towards a bearish sentiment in the market with potential for a reversal.
Volatility Analysis:
- Bollinger Bands: The Bollinger Bands have shown narrowing bands, indicating decreasing volatility in the stock price.
- Volatility Percentage: The volatility percentage has been relatively low, suggesting a stable price movement.
Key Observation: Volatility indicators signal a period of consolidation and stability in the stock price.
Volume Analysis:
- On-Balance Volume (OBV): The OBV has been negative, indicating a net selling pressure in the stock.
- Chaikin Money Flow (CMF): The CMF has shown some positive values, suggesting a potential inflow of money into the stock.
Key Observation: Volume indicators reflect a mixed sentiment with selling pressure but also some signs of buying interest.
Conclusion:
Based on the analysis of the technical indicators, the next few days for BRZU could see further downward movement in the stock price. The trend indicators lack a clear direction, but momentum indicators suggest a bearish sentiment. Volatility indicators point towards consolidation, while volume indicators show a mix of selling pressure and potential buying interest.
Overall View: Bearish with a possibility of sideways consolidation in the near term. Traders should exercise caution and consider risk management strategies in their trading decisions.