Technical Analysis of BSCP 2024-05-10
Overview:
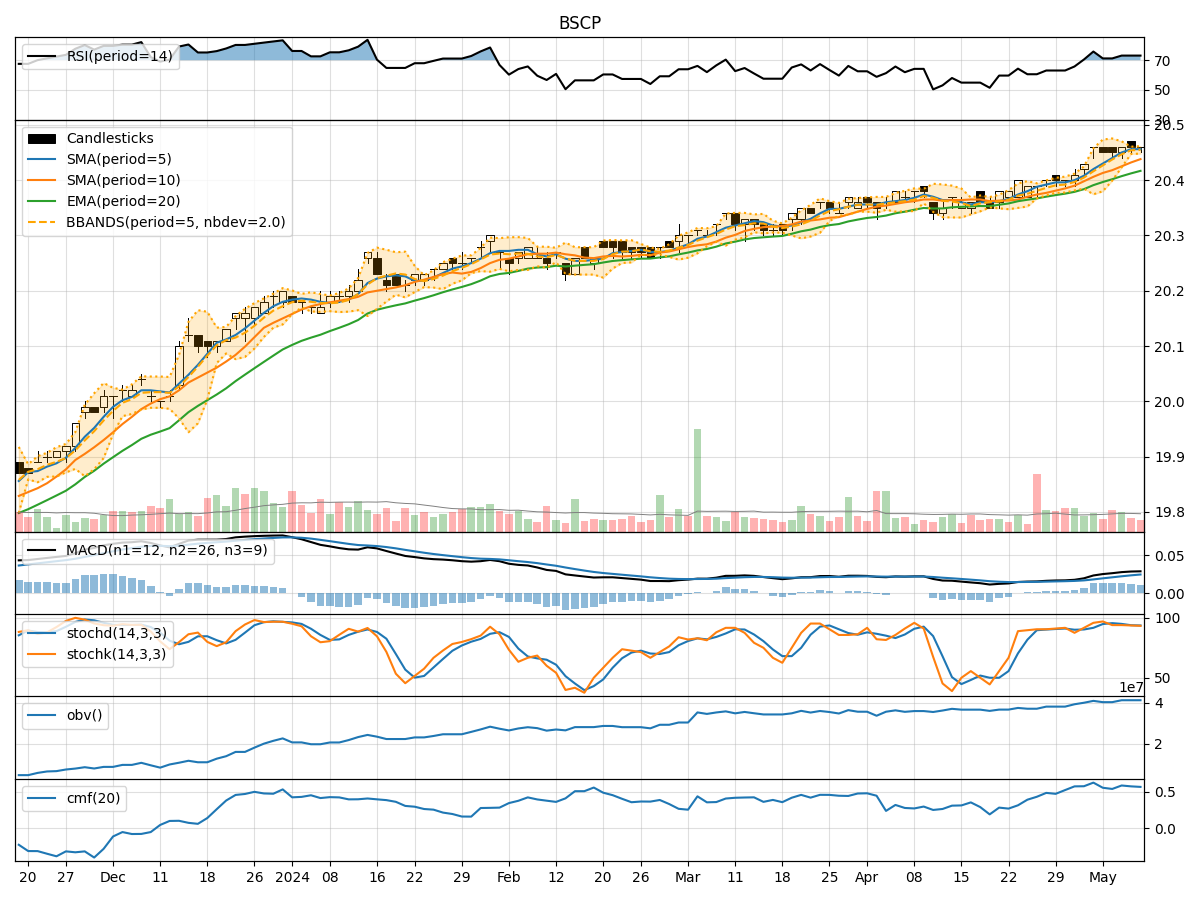
In analyzing the technical indicators for BSCP over the last 5 days, we will delve into the trend, momentum, volatility, and volume indicators to provide a comprehensive outlook on the possible stock price movement in the coming days.
Trend Indicators:
- Moving Averages (MA): The 5-day MA has been consistently above the closing price, indicating a short-term uptrend.
- MACD: The MACD line has been steadily increasing, with the MACD histogram also showing positive values, suggesting bullish momentum.
- EMA: The exponential moving average has been trending upwards, supporting the bullish sentiment.
Momentum Indicators:
- RSI: The Relative Strength Index has been in the overbought territory, indicating a strong bullish momentum.
- Stochastic Oscillator: Both %K and %D have been high, suggesting an overbought condition.
- Williams %R: The indicator has been in the oversold region, signaling a potential reversal.
Volatility Indicators:
- Bollinger Bands: The bands have been narrowing, indicating decreasing volatility and a possible consolidation phase.
- Bollinger %B: The %B indicator has been hovering around the middle, reflecting a neutral stance in terms of volatility.
Volume Indicators:
- On-Balance Volume (OBV): The OBV has been relatively stable, showing consistent buying pressure.
- Chaikin Money Flow (CMF): The CMF has been positive, indicating money flow into the stock.
Key Observations:
- The trend indicators suggest a bullish bias, supported by moving averages and MACD.
- Momentum indicators point to a strong bullish momentum but also indicate potential overbought conditions.
- Volatility indicators show a decrease in volatility, possibly leading to a consolidation phase.
- Volume indicators reflect consistent buying pressure and positive money flow into the stock.
Conclusion:
Based on the analysis of the technical indicators, the stock is likely to experience a consolidation phase in the coming days. The bullish trend may continue, but the overbought conditions and decreasing volatility suggest a period of sideways movement or a slight correction before potentially resuming the uptrend. Traders should exercise caution and consider taking profits or implementing risk management strategies in anticipation of a possible pullback.