Technical Analysis of BSCT 2024-05-10
Overview:
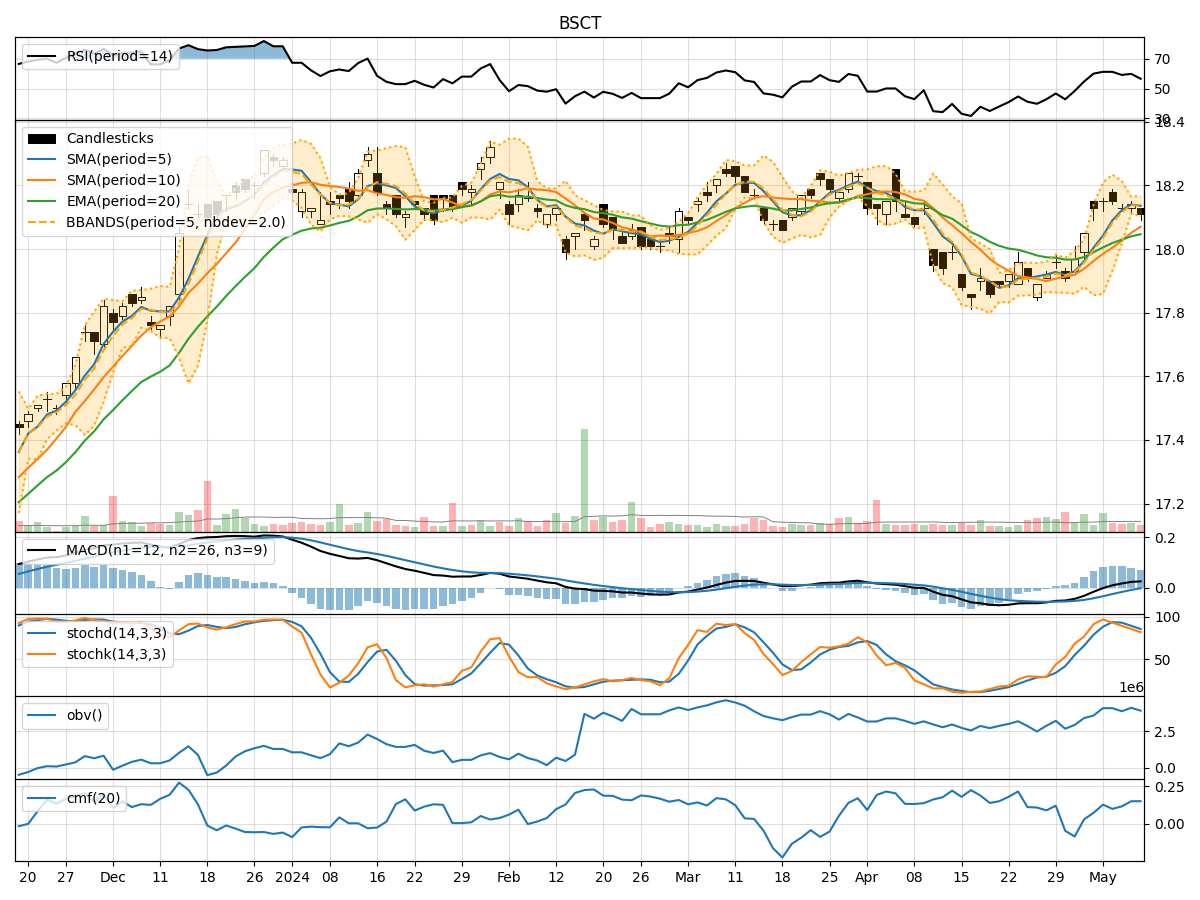
In the last 5 trading days, BSCT stock has shown relatively stable price movements with minor fluctuations. The trend indicators suggest a slightly bullish sentiment, supported by moving averages and MACD values. Momentum indicators indicate a neutral to slightly bearish momentum, while volatility indicators show decreasing volatility. Volume indicators reflect a mixed sentiment with fluctuations in On-Balance Volume (OBV) and Chaikin Money Flow (CMF) values.
Trend Indicators Analysis:
- Moving Averages (MA): The 5-day MA has been consistently above the closing prices, indicating a bullish trend.
- MACD: The MACD line has been above the signal line, suggesting a bullish momentum.
- EMA: The EMA values have been gradually increasing, supporting a bullish outlook.
Momentum Indicators Analysis:
- RSI: The RSI values have been fluctuating around the neutral zone, indicating indecision in momentum.
- Stochastic Oscillator: Both %K and %D values have been decreasing, signaling a potential bearish momentum shift.
- Williams %R: The Williams %R values have been in the oversold territory, suggesting a possible reversal.
Volatility Indicators Analysis:
- Bollinger Bands (BB): The narrowing of the Bollinger Bands indicates decreasing volatility and a potential price breakout.
- BB %B: The %B values have been fluctuating around the midline, reflecting consolidation.
Volume Indicators Analysis:
- On-Balance Volume (OBV): The OBV values have shown fluctuations, indicating mixed buying and selling pressure.
- Chaikin Money Flow (CMF): The CMF values have been hovering around the zero line, suggesting a balance between buying and selling pressure.
Key Observations:
- The trend indicators suggest a bullish bias, supported by moving averages and MACD values.
- Momentum indicators show a neutral to slightly bearish sentiment, with potential for a bearish momentum shift.
- Volatility indicators indicate decreasing volatility and a potential price breakout.
- Volume indicators reflect mixed sentiment with fluctuations in OBV and CMF values.
Conclusion:
Based on the analysis of technical indicators, the next few days' possible stock price movement for BSCT is likely to be sideways with a slight bearish bias. Traders should watch for potential reversal signals in momentum indicators like the Stochastic Oscillator and Williams %R. The decreasing volatility may lead to a breakout, so it is essential to monitor the Bollinger Bands for any significant price movements. Overall, a cautious approach with a focus on key support and resistance levels is recommended in the current market environment.