Technical Analysis of BSJU 2024-05-10
Overview:
In analyzing the technical indicators for BSJU stock over the last 5 days, we will delve into the trend, momentum, volatility, and volume indicators to provide a comprehensive outlook on the possible future stock price movement. By examining these key indicators, we aim to offer valuable insights and predictions for the upcoming trading days.
Trend Indicators:
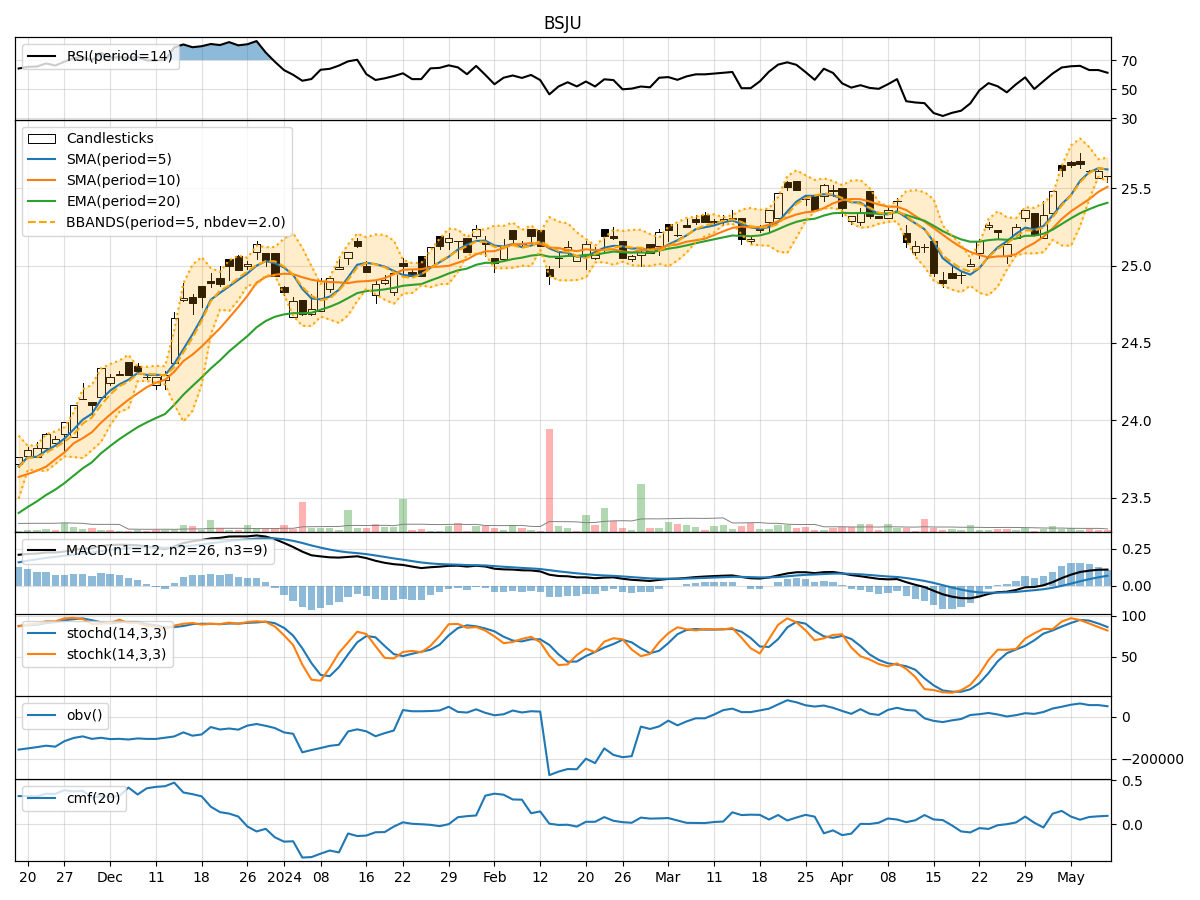
- Moving Averages (MA): The 5-day Moving Average (MA) has been consistently above the Simple Moving Average (SMA) and Exponential Moving Average (EMA), indicating a bullish trend.
- MACD: The MACD line has been above the signal line, with both lines showing an upward trend, suggesting bullish momentum.
- MACD Histogram: The MACD Histogram has been increasing over the past 5 days, indicating strengthening bullish momentum.
Momentum Indicators:
- RSI: The Relative Strength Index (RSI) has been in the overbought territory above 70, suggesting a strong bullish momentum.
- Stochastic Oscillator: Both %K and %D lines of the Stochastic Oscillator have been decreasing but remain in the overbought zone, indicating a potential reversal.
- Williams %R: The Williams %R has been in the oversold region, signaling a potential buying opportunity.
Volatility Indicators:
- Bollinger Bands: The stock price has been trading within the Bollinger Bands, with the bands narrowing, indicating decreasing volatility.
- Bollinger %B: The %B indicator has been hovering around 0.5, suggesting the stock is trading at the middle of the bands.
Volume Indicators:
- On-Balance Volume (OBV): The OBV has been fluctuating but has not shown a clear trend, indicating mixed buying and selling pressure.
- Chaikin Money Flow (CMF): The CMF has been positive, indicating that money is flowing into the stock.
Key Observations:
- The trend indicators suggest a strong bullish sentiment with moving averages and MACD signaling an upward trend.
- Momentum indicators show mixed signals with RSI in overbought territory and Stochastic Oscillator hinting at a potential reversal.
- Volatility indicators point towards decreasing volatility, potentially leading to a period of consolidation.
- Volume indicators indicate mixed buying and selling pressure, with money flowing into the stock according to CMF.
Conclusion:
Based on the analysis of the technical indicators, the next few days for BSJU stock could see further upward movement in the stock price. The bullish trend indicated by moving averages and MACD, coupled with positive money flow according to CMF, suggests a potential continuation of the uptrend. However, caution is advised as the Stochastic Oscillator signals a possible reversal, and the stock may enter a consolidation phase due to decreasing volatility. Traders should closely monitor key levels and wait for confirmation of the trend before making trading decisions.