Technical Analysis of BSJV 2024-05-10
Overview:
In analyzing the technical indicators for BSJV stock over the last 5 days, we will delve into the trend, momentum, volatility, and volume indicators to provide a comprehensive outlook on the possible future stock price movement. By examining these key indicators, we aim to offer valuable insights and predictions for the upcoming trading days.
Trend Indicators:
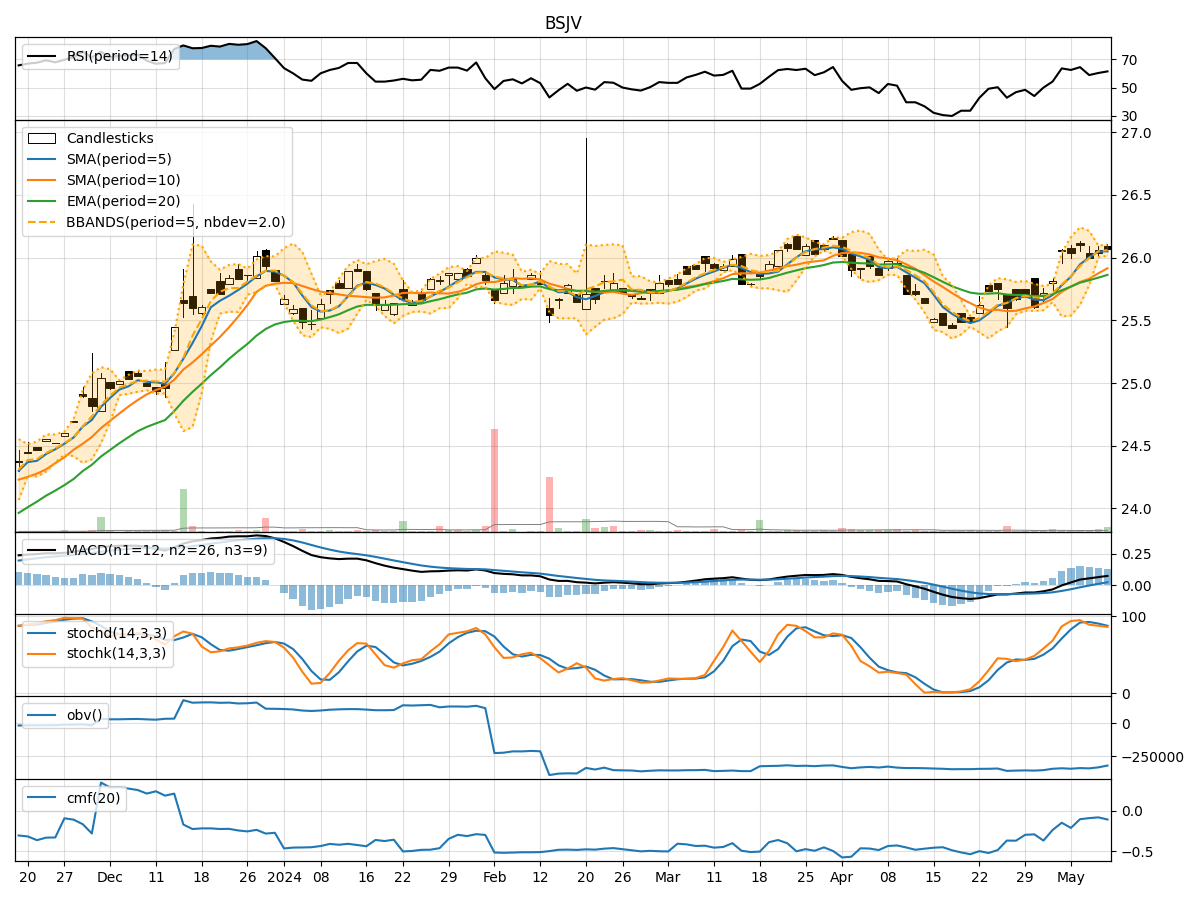
- Moving Averages (MA): The 5-day Moving Average (MA) has been consistently above the Simple Moving Average (SMA) and Exponential Moving Average (EMA), indicating a bullish trend.
- MACD: The Moving Average Convergence Divergence (MACD) has shown positive values, with the MACD line consistently above the Signal line, suggesting bullish momentum.
- MACD Histogram: The MACD Histogram has been increasing, indicating strengthening bullish momentum.
Momentum Indicators:
- RSI: The Relative Strength Index (RSI) has been in the neutral zone around 60-65, suggesting neither overbought nor oversold conditions.
- Stochastic Oscillator: Both %K and %D lines of the Stochastic Oscillator have been declining but remain in the overbought territory, indicating a potential reversal.
- Williams %R: The Williams %R is hovering around -10 to -20, signaling a potential overbought condition.
Volatility Indicators:
- Bollinger Bands: The Bollinger Bands have been narrowing, indicating decreasing volatility in the stock price.
- Bollinger %B: The %B indicator has been fluctuating within a narrow range, suggesting a period of consolidation.
Volume Indicators:
- On-Balance Volume (OBV): The OBV has been declining, indicating selling pressure in the stock.
- Chaikin Money Flow (CMF): The CMF has been negative, suggesting a lack of buying interest in the stock.
Key Observations and Opinions:
- Trend: The trend indicators suggest a bullish bias in the stock price movement.
- Momentum: Momentum indicators show mixed signals, with a potential reversal in the overbought territory.
- Volatility: Volatility indicators point towards decreasing volatility and a period of consolidation.
- Volume: Volume indicators indicate selling pressure and a lack of significant buying interest.
Conclusion:
Based on the analysis of the technical indicators, the next few days for BSJV stock are likely to see sideways movement with a slight bearish bias. Traders should exercise caution and consider potential profit-taking opportunities as the stock may experience a period of consolidation. It is advisable to closely monitor key support and resistance levels for potential entry and exit points.