Technical Analysis of BSMQ 2024-05-10
Overview:
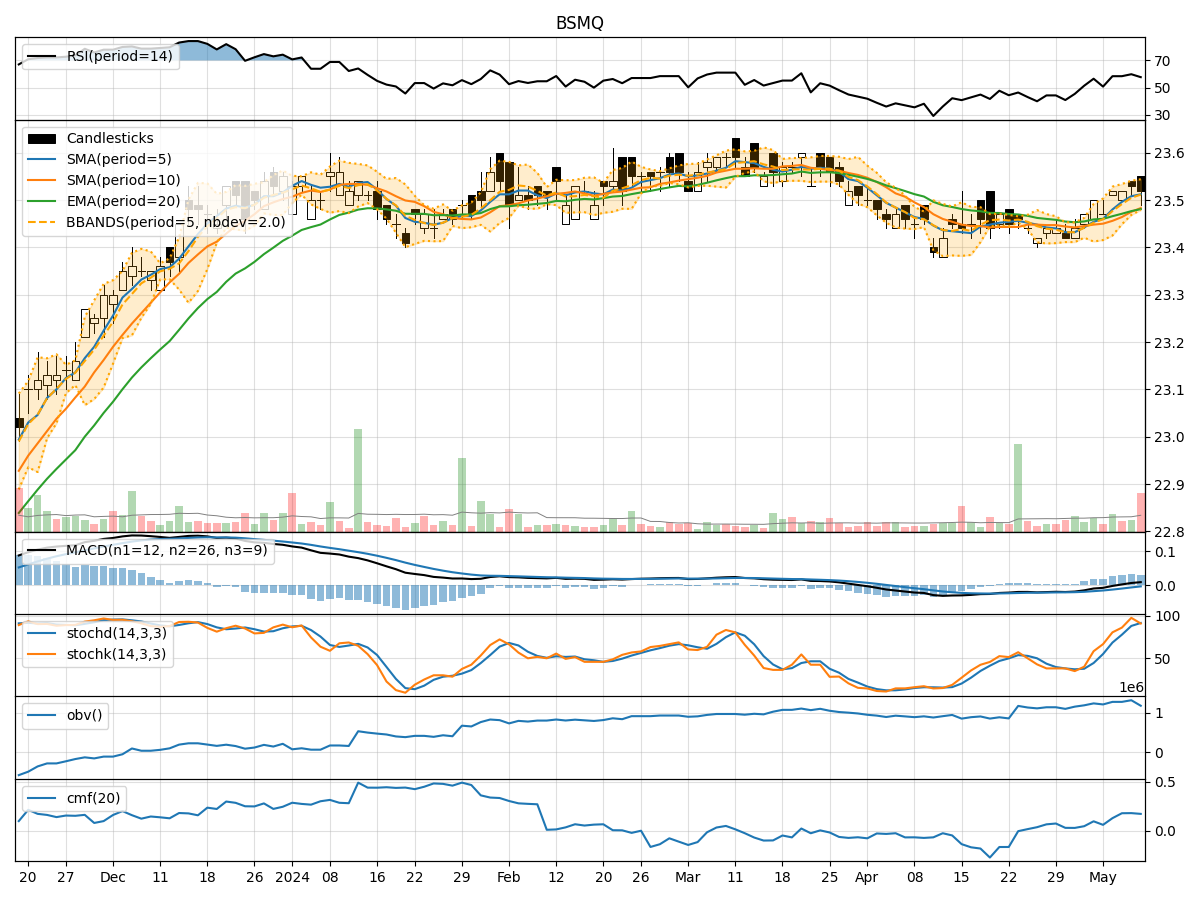
In the last 5 days, BSMQ stock has shown relatively stable price movements with minor fluctuations. The trend indicators suggest a slight upward trend, supported by the moving averages and MACD. Momentum indicators indicate a positive momentum, with RSI showing a moderate strength. Volatility indicators show a narrowing Bollinger Bands, indicating decreasing volatility. Volume indicators suggest a consistent accumulation of volume.
Trend Indicators:
- Moving Averages (MA): The 5-day MA has been trending slightly upwards, indicating a positive short-term trend.
- MACD: The MACD line has been consistently above the signal line, suggesting bullish momentum.
- EMA: The EMA has been gradually increasing, supporting the bullish sentiment.
Momentum Indicators:
- RSI: The RSI has been hovering around the 50 level, indicating a neutral stance with a slight positive bias.
- Stochastic Oscillator: Both %K and %D have been in the overbought zone, suggesting a potential reversal or consolidation.
- Williams %R: The indicator has been in the oversold territory, indicating a possible buying opportunity.
Volatility Indicators:
- Bollinger Bands: The narrowing of the bands suggests decreasing volatility and a potential period of consolidation.
- Bollinger %B: The %B indicator is below 1, indicating the price is trading below the upper Bollinger Band.
Volume Indicators:
- On-Balance Volume (OBV): The OBV has been relatively stable, indicating consistent accumulation of volume.
- Chaikin Money Flow (CMF): The CMF has been positive, suggesting buying pressure in the stock.
Key Observations:
- The stock is currently in a slight uptrend based on moving averages and MACD.
- Momentum indicators show a mixed signal with RSI neutral, Stochastic overbought, and Williams %R oversold.
- Volatility is decreasing, indicating a potential period of consolidation.
- Volume indicators suggest consistent accumulation of volume, supporting the current trend.
Conclusion:
Based on the technical analysis of the trend, momentum, volatility, and volume indicators, the next few days' possible stock price movement for BSMQ is likely to continue in a sideways consolidation pattern. The stock may experience some range-bound trading with limited upside or downside potential. Traders should watch for a breakout above the upper Bollinger Band or a breakdown below the lower Bollinger Band for potential trading opportunities. It is advisable to wait for clearer signals before taking significant positions.