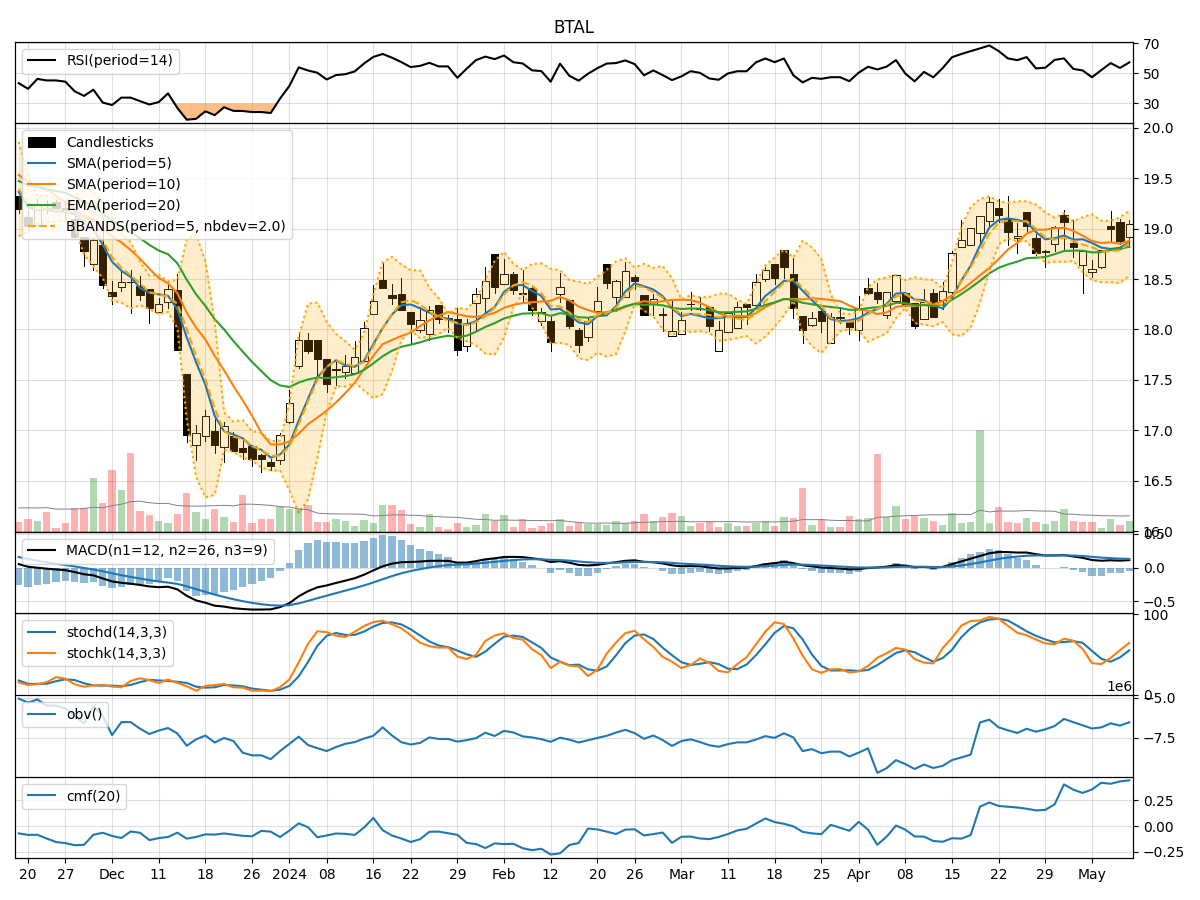
Technical Analysis of BTAL 2024-05-10
Overview:
In analyzing the technical indicators for BTAL over the last 5 days, we will delve into the trend, momentum, volatility, and volume indicators to provide a comprehensive outlook on the possible stock price movement in the coming days.
Trend Analysis:
- Moving Averages (MA): The 5-day Moving Average (MA) has been fluctuating around the closing prices, indicating a short-term trend. The Simple Moving Average (SMA) and Exponential Moving Average (EMA) show a slight upward trend.
- MACD: The Moving Average Convergence Divergence (MACD) and its signal line have been positive, suggesting a bullish momentum.
- Conclusion: The trend indicators point towards a slightly bullish sentiment in the short term.
Momentum Analysis:
- RSI: The Relative Strength Index (RSI) has been hovering around the mid-level, indicating a balanced momentum.
- Stochastic Oscillator: Both %K and %D have been in the overbought zone, suggesting a potential reversal.
- Williams %R: The Williams %R is also in the overbought territory, signaling a possible pullback.
- Conclusion: The momentum indicators suggest a potential reversal or consolidation in the near future.
Volatility Analysis:
- Bollinger Bands: The stock price has been trading within the Bollinger Bands, with the bands slightly widening, indicating increased volatility.
- Conclusion: The volatility indicators imply heightened price fluctuations in the upcoming sessions.
Volume Analysis:
- On-Balance Volume (OBV): The OBV has shown a positive trend, indicating accumulation by investors.
- Chaikin Money Flow (CMF): The CMF has been positive, reflecting buying pressure in the stock.
- Conclusion: The volume indicators suggest bullish sentiment as investors continue to accumulate the stock.
Overall Conclusion:
Based on the analysis of trend, momentum, volatility, and volume indicators, the next few days' possible stock price movement for BTAL is likely to be sideways to slightly bullish with a potential for a short-term pullback due to overbought conditions in momentum indicators. Investors should closely monitor the price action within the Bollinger Bands and watch for any signs of reversal indicated by the Stochastic Oscillator and Williams %R. The positive volume indicators support the bullish bias, but caution is advised given the potential for increased volatility.