Technical Analysis of CAAA 2024-05-10
Overview:
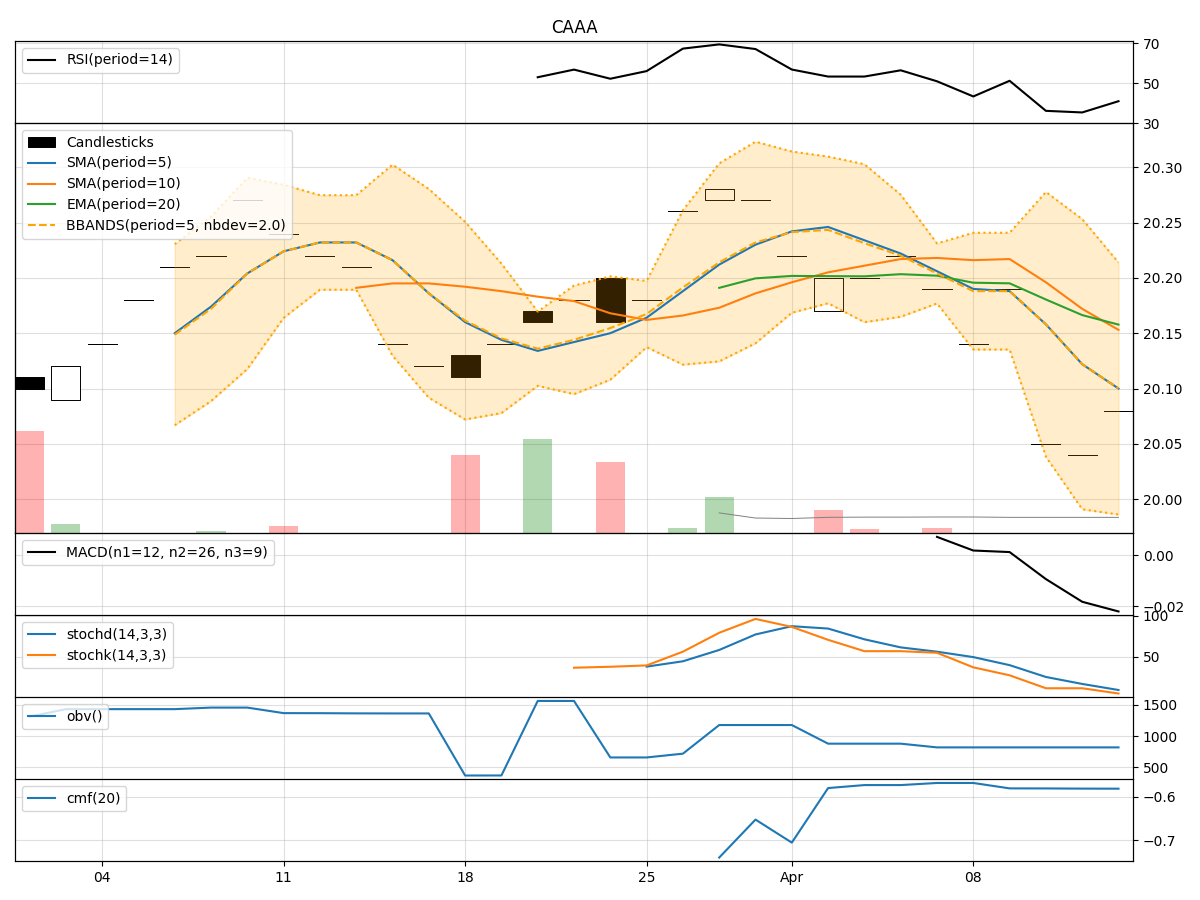
In analyzing the technical indicators for CAAA stock over the last 5 days, we will delve into the trends, momentum, volatility, and volume aspects to provide a comprehensive outlook on the possible stock price movement in the coming days. By examining key indicators such as moving averages, MACD, RSI, Bollinger Bands, and OBV, we aim to offer valuable insights and predictions for potential price action.
Trend Analysis:
- Moving Averages (MA): The 5-day MA has been consistently above the closing prices, indicating a short-term uptrend.
- MACD: The MACD line has been above the signal line, suggesting bullish momentum.
- EMA: The EMA has been trending upwards, supporting the bullish sentiment.
Key Observation: The trend indicators point towards an upward trajectory for CAAA stock.
Momentum Analysis:
- RSI: The RSI has been fluctuating around the overbought territory, indicating strong buying pressure.
- Stochastic Oscillator: Both %K and %D have been relatively high, signaling bullish momentum.
- Williams %R: The indicator has been hovering in the oversold region, suggesting potential buying opportunities.
Key Observation: Momentum indicators reflect a bullish sentiment for CAAA stock.
Volatility Analysis:
- Bollinger Bands: The stock price has been trading within the bands, indicating moderate volatility.
- Bollinger %B: The %B value has been fluctuating around the midline, suggesting a balanced market sentiment.
Key Observation: Volatility indicators suggest a sideways movement or consolidation phase for CAAA stock.
Volume Analysis:
- On-Balance Volume (OBV): The OBV has been relatively stable, indicating a neutral volume flow.
- Chaikin Money Flow (CMF): The CMF has been negative, signaling a bearish volume trend.
Key Observation: Volume indicators point towards a neutral to bearish volume sentiment.
Conclusion:
Based on the comprehensive analysis of trend, momentum, volatility, and volume indicators, the overall outlook for CAAA stock in the next few days leans towards a bullish bias. The strong uptrend indicated by moving averages and MACD, coupled with bullish momentum from RSI and Stochastic Oscillator, suggests potential price appreciation. However, the sideways movement indicated by volatility indicators and the bearish volume sentiment from OBV and CMF warrant caution.
In conclusion, the next few days for CAAA stock are likely to see an upward price movement with potential consolidation phases. Traders should monitor key support and resistance levels for timely entry and exit points.