Technical Analysis of CDX 2024-05-10
Overview:
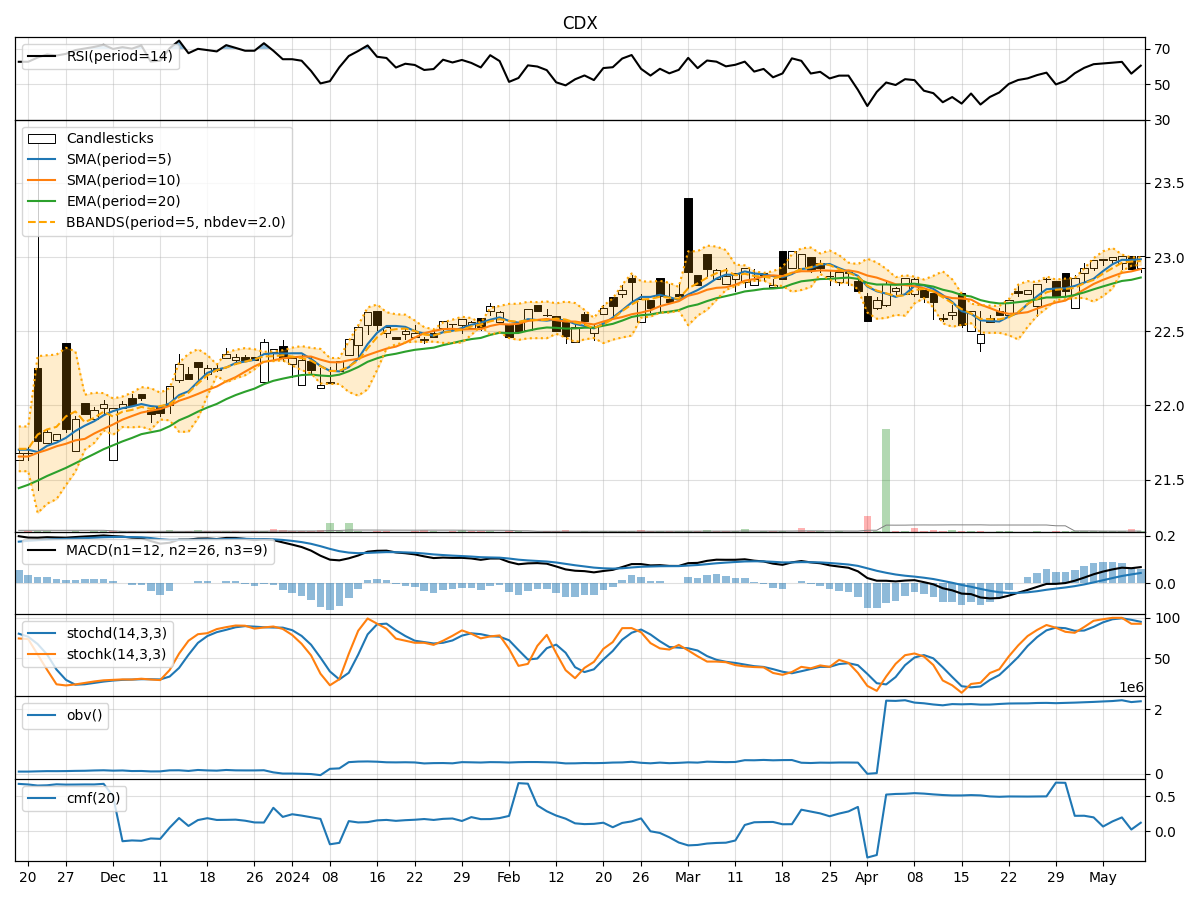
In the last 5 trading days, CDX stock has shown a relatively stable price movement with minor fluctuations. The trend indicators suggest a slight uptrend, supported by moving averages and MACD indicators. Momentum indicators indicate a neutral to slightly bullish sentiment, while volatility indicators show a narrowing Bollinger Bands range. Volume indicators reflect a consistent but not significant increase in trading volume.
Trend Indicators:
- Moving Averages (MA): The 5-day moving average has been consistently above the 10-day simple moving average, indicating a short-term uptrend.
- MACD: The MACD line has been above the signal line, suggesting bullish momentum.
Key Observation: The trend indicators point towards a bullish sentiment in the short term.
Momentum Indicators:
- RSI: The Relative Strength Index (RSI) has been hovering around the neutral level, indicating a balanced buying and selling pressure.
- Stochastic Oscillator: The Stochastic indicators are in the overbought territory, suggesting a potential reversal or consolidation.
Key Observation: Momentum indicators suggest a neutral to slightly bullish sentiment.
Volatility Indicators:
- Bollinger Bands (BB): The Bollinger Bands are narrowing, indicating decreasing volatility and a potential breakout in price.
Key Observation: Volatility indicators suggest a potential price breakout in the near future.
Volume Indicators:
- On-Balance Volume (OBV): The OBV has shown a slight increase, indicating a positive accumulation of volume.
- Chaikin Money Flow (CMF): The CMF is positive but not significantly strong, suggesting a moderate inflow of money into the stock.
Key Observation: Volume indicators reflect a moderate increase in trading activity.
Conclusion:
Based on the analysis of the technical indicators, the next few days' possible stock price movement for CDX is likely to be bullish in the short term. The trend indicators support an uptrend, while momentum indicators indicate a neutral to slightly bullish sentiment. Volatility indicators suggest a potential breakout in price, and volume indicators show a moderate increase in trading activity. Traders and investors may consider buying opportunities in CDX stock for potential short-term gains.