Technical Analysis of CLIA 2024-05-31
Overview:
In analyzing the technical indicators for CLIA over the last 5 days, we will delve into the trend, momentum, volatility, and volume indicators to provide a comprehensive outlook on the possible stock price movement in the coming days. By examining these key aspects, we aim to offer valuable insights and predictions for potential investors.
Trend Indicators:
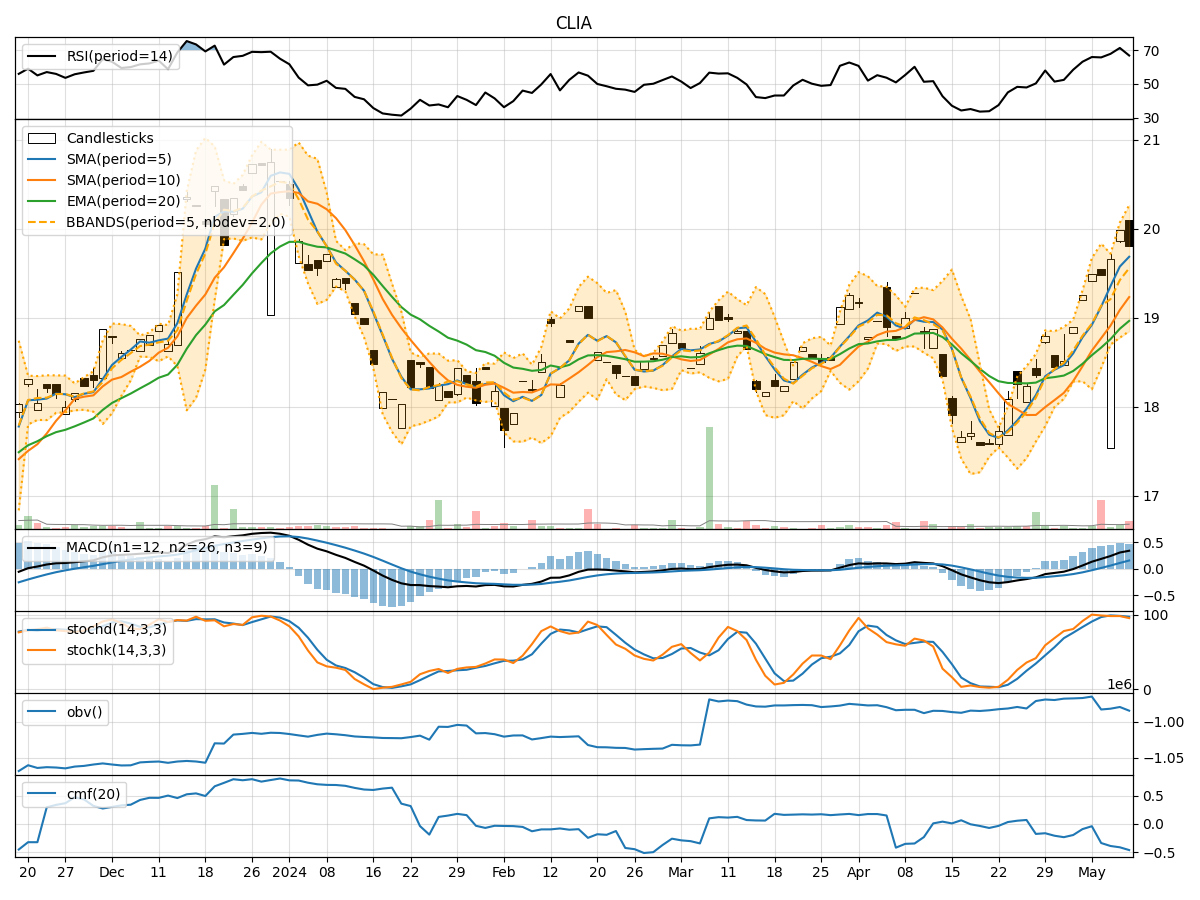
- Moving Averages (MA): The 5-day moving average has been consistently above the simple moving average (SMA) and exponential moving average (EMA), indicating a bullish trend.
- MACD: The MACD line has been consistently above the signal line, suggesting a positive momentum in the stock price.
- MACD Histogram: The MACD histogram has been increasing, indicating strengthening bullish momentum.
Momentum Indicators:
- RSI: The Relative Strength Index (RSI) has been fluctuating around the overbought territory, suggesting a potential consolidation phase.
- Stochastic Oscillator: Both %K and %D have been relatively high, indicating a bullish momentum.
- Williams %R: The Williams %R has shown oversold conditions, potentially signaling a reversal in the short term.
Volatility Indicators:
- Bollinger Bands: The stock price has been trading within the Bollinger Bands, with the bands narrowing, indicating reduced volatility.
- Bollinger %B: The %B indicator has been hovering around the middle range, suggesting a neutral stance in terms of volatility.
Volume Indicators:
- On-Balance Volume (OBV): The OBV has been relatively stable, indicating a balance between buying and selling pressure.
- Chaikin Money Flow (CMF): The CMF has been negative, suggesting a bearish sentiment in the stock.
Key Observations and Opinions:
- Trend: The trend indicators point towards a bullish sentiment in the stock price.
- Momentum: The momentum indicators show mixed signals, with RSI indicating a potential consolidation phase and Stochastic Oscillator signaling bullish momentum.
- Volatility: Volatility has been decreasing, potentially leading to a period of consolidation.
- Volume: The volume indicators suggest a balance between buying and selling pressure, with a slightly bearish sentiment indicated by CMF.
Conclusion:
Based on the analysis of the technical indicators, the next few days' possible stock price movement for CLIA is likely to be sideways with a slight bullish bias. Investors should monitor the RSI for any potential reversal signals and keep an eye on the OBV for changes in buying and selling pressure. Overall, the stock is expected to consolidate within a narrow range with a potential upward bias in the short term.