Technical Analysis of CMBS 2024-05-10
Overview:
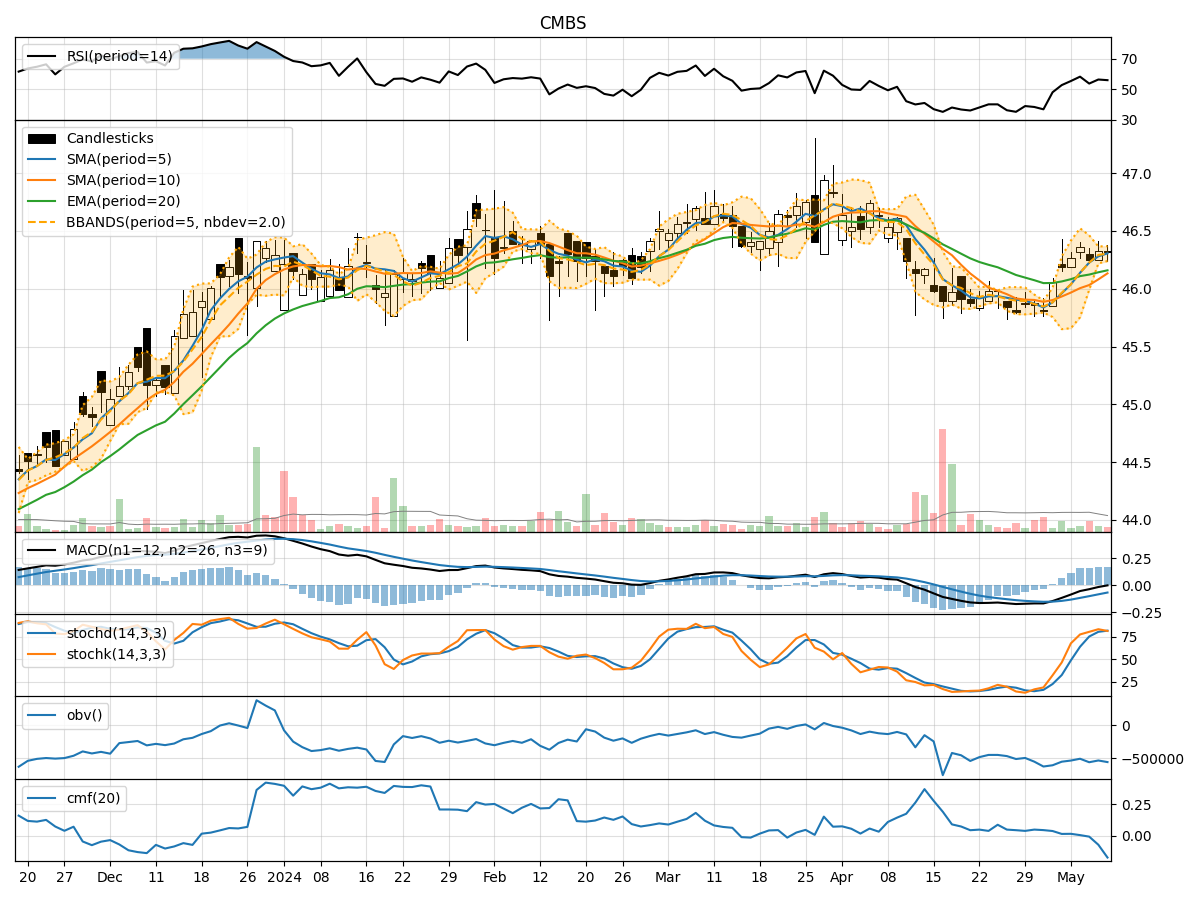
In analyzing the technical indicators for CMBS over the last 5 days, we will delve into the trend, momentum, volatility, and volume indicators to provide a comprehensive outlook on the possible stock price movement. By examining these key aspects, we aim to offer valuable insights and predictions for the upcoming days.
Trend Analysis:
- Moving Averages (MA): The 5-day Moving Average (MA) has been showing a slight uptrend, indicating a positive momentum in the short term.
- MACD: The Moving Average Convergence Divergence (MACD) has been consistently positive, suggesting bullish momentum.
- EMA: The Exponential Moving Average (EMA) has been trending slightly upwards, supporting the bullish sentiment.
Momentum Analysis:
- RSI: The Relative Strength Index (RSI) has been fluctuating around the neutral zone, indicating a balanced momentum.
- Stochastic Oscillator: Both %K and %D have been in the overbought territory, signaling a potential reversal or consolidation.
- Williams %R: The Williams %R is in the oversold region, suggesting a possible buying opportunity.
Volatility Analysis:
- Bollinger Bands (BB): The Bollinger Bands have been narrowing, indicating decreasing volatility and a potential breakout in the near future.
- BB%: The %B indicator has been hovering around the middle band, reflecting a period of consolidation.
Volume Analysis:
- On-Balance Volume (OBV): The OBV has been fluctuating, indicating indecision among market participants.
- Chaikin Money Flow (CMF): The CMF has been negative, suggesting a bearish sentiment in terms of money flow.
Key Observations:
- The trend indicators suggest a bullish bias in the short term.
- Momentum indicators show mixed signals with potential for a reversal or consolidation.
- Volatility is decreasing, hinting at a possible breakout.
- Volume indicators reflect uncertainty and a bearish money flow sentiment.
Conclusion:
Based on the analysis of the technical indicators, the next few days for CMBS could see sideways consolidation with a slight upward bias. Traders should exercise caution and closely monitor key levels for potential breakout opportunities. The stock is likely to experience range-bound trading until a clear trend direction emerges.