Technical Analysis of CMDY 2024-05-10
Overview:
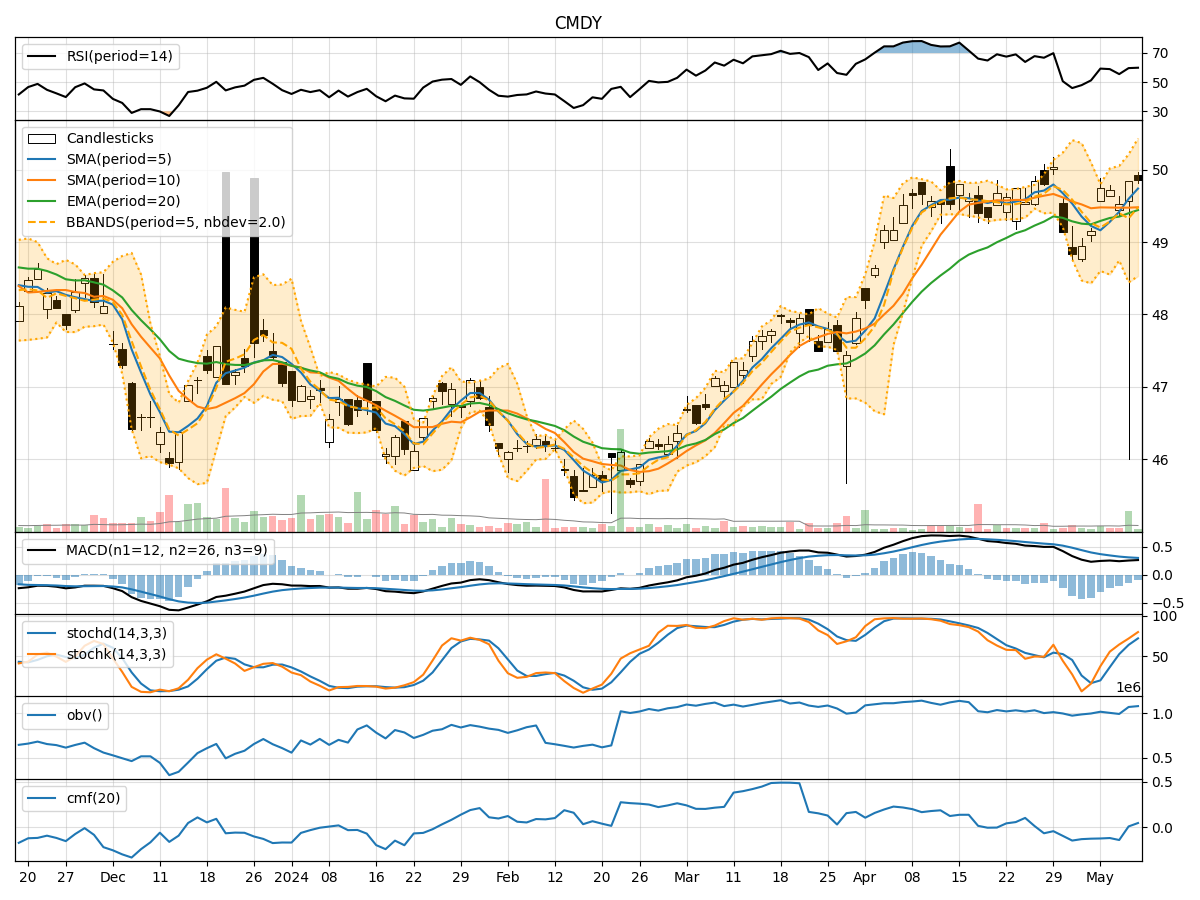
In the last 5 trading days, CMDY stock has shown mixed signals across various technical indicators. The trend indicators suggest a slight bullish sentiment with the moving averages trending upwards. Momentum indicators show a neutral to slightly bullish stance, while volatility indicators indicate a decrease in volatility. Volume indicators show a mixed picture with a slight increase in On-Balance Volume (OBV) and Chaikin Money Flow (CMF).
Trend Indicators:
- Moving Averages (MA): The 5-day MA is above the 10-day SMA, indicating a short-term bullish trend. The EMA(20) is also trending upwards, supporting a bullish view.
- MACD: The MACD line is above the signal line, suggesting a bullish momentum.
- MACD Histogram: The MACD Histogram is decreasing but still above the zero line, indicating a weakening bullish momentum.
Momentum Indicators:
- RSI: The RSI is in the neutral zone around 60, indicating neither overbought nor oversold conditions.
- Stochastic Oscillator: Both %K and %D lines are in the overbought zone, suggesting a potential reversal or consolidation.
- Williams %R: The Williams %R is close to the oversold territory, indicating a possible buying opportunity.
Volatility Indicators:
- Bollinger Bands (BB): The bands are narrowing, indicating decreasing volatility and a potential consolidation phase.
- Bollinger %B: The %B is around 0.75, suggesting the stock is trading closer to the upper band.
- Average True Range (ATR): ATR is decreasing, indicating a decline in volatility.
Volume Indicators:
- On-Balance Volume (OBV): OBV has shown a slight increase over the last 5 days, indicating some accumulation.
- Chaikin Money Flow (CMF): CMF is positive but relatively flat, suggesting a neutral money flow trend.
Conclusion:
Based on the analysis of the technical indicators, the next few days for CMDY stock are likely to see sideways consolidation with a slight bullish bias. The trend indicators support a bullish view, while momentum indicators suggest a neutral stance with a potential for a reversal. Volatility indicators point towards decreasing volatility and a possible consolidation phase. Volume indicators show a mixed picture but with a slight accumulation.
Key Conclusion: The stock is likely to trade within a range in the near term, with a potential for a slight upside movement. Traders may consider waiting for a clearer signal or confirmation before taking significant positions.