Technical Analysis of CONY 2024-05-10
Overview:
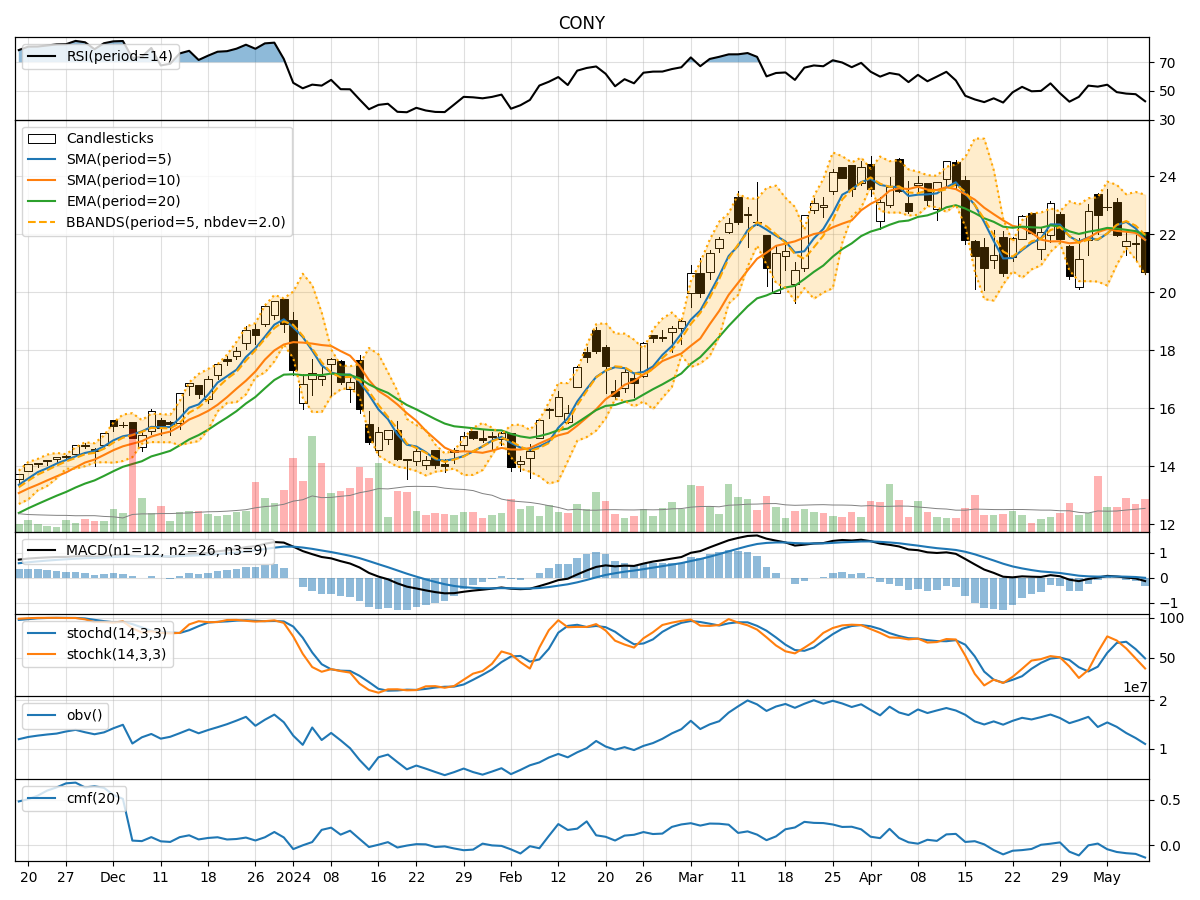
In analyzing the technical indicators for CONY stock over the last 5 days, we will delve into the trends, momentum, volatility, and volume aspects to provide a comprehensive outlook on the possible stock price movement in the coming days. By examining key indicators such as moving averages, MACD, RSI, Bollinger Bands, and OBV, we aim to offer valuable insights and predictions for potential investors.
Trend Analysis:
- Moving Averages (MA): The 5-day MA has been declining steadily, indicating a short-term bearish trend.
- MACD: The MACD line has been consistently below the signal line, suggesting a bearish momentum.
- EMA: The EMA has also been trending downwards, aligning with the bearish sentiment in the short term.
Momentum Analysis:
- RSI: The RSI has been decreasing, reflecting a weakening momentum and potential oversold conditions.
- Stochastic Oscillator: Both %K and %D have been declining, indicating a bearish momentum.
- Williams %R: The indicator has been in the oversold territory, signaling a potential reversal or bounce.
Volatility Analysis:
- Bollinger Bands: The stock price has been trading below the lower Bollinger Band, indicating oversold conditions and potential for a reversal.
- Bollinger Band Width: The band width has been narrowing, suggesting a decrease in volatility and a possible period of consolidation.
Volume Analysis:
- On-Balance Volume (OBV): The OBV has been declining, indicating selling pressure and potential bearish sentiment.
- Chaikin Money Flow (CMF): The CMF has been negative, suggesting outflow of money from the stock.
Conclusion:
Based on the analysis of the technical indicators, the stock is currently in a bearish phase with downward trends in moving averages, MACD, RSI, and OBV. The momentum indicators also support a bearish outlook with oversold conditions. However, the narrowing Bollinger Bands and oversold Williams %R signal a potential reversal or bounce in the near future. Investors should exercise caution and closely monitor the price action for any signs of a reversal before considering any bullish positions.