Technical Analysis of CTA 2024-05-10
Overview:
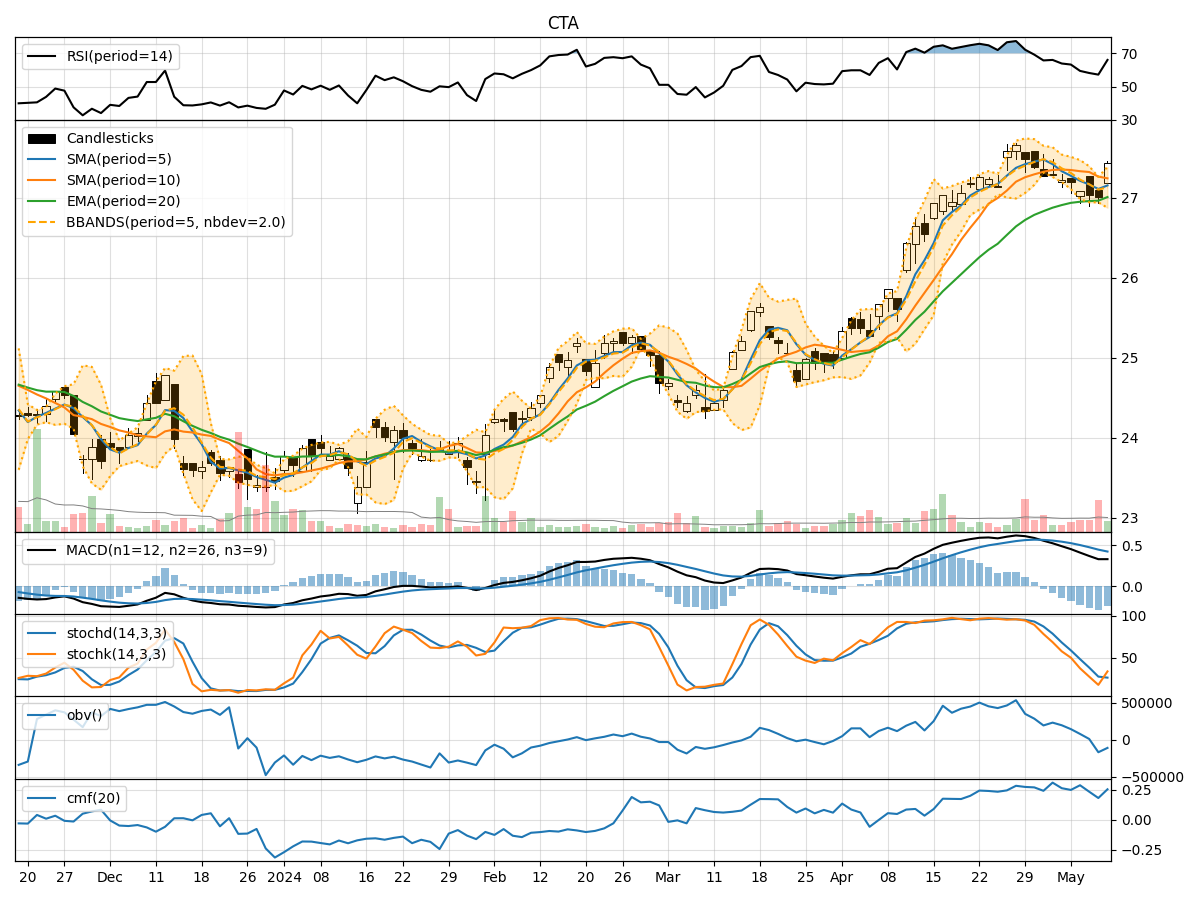
In the last 5 trading days, the stock has shown mixed signals across various technical indicators. The moving averages have been fluctuating, the MACD has been decreasing, the RSI has been declining, and the Bollinger Bands have shown widening volatility. The OBV and CMF have also been inconsistent. Based on these indicators, the stock may face some uncertainty in the near future.
Trend Indicators Analysis:
- Moving Averages (MA): The 5-day MA has been fluctuating around the closing price, indicating indecision in the short term.
- MACD: The MACD has been decreasing, with the MACD line moving below the signal line, suggesting a potential bearish momentum.
Momentum Indicators Analysis:
- RSI: The RSI has been declining, indicating weakening momentum.
- Stochastic Oscillator: Both %K and %D have been decreasing, showing a bearish sentiment.
Volatility Indicators Analysis:
- Bollinger Bands (BB): The Bollinger Bands have been widening, suggesting increased volatility in the stock price.
Volume Indicators Analysis:
- On-Balance Volume (OBV): The OBV has shown mixed signals, indicating uncertainty in the buying and selling pressure.
- Chaikin Money Flow (CMF): The CMF has been inconsistent, reflecting a lack of clear direction in the money flow.
Key Observations and Opinions:
- Trend: The trend indicators show a lack of clear direction, with mixed signals from moving averages and a bearish crossover in the MACD.
- Momentum: Momentum indicators like RSI and Stochastic Oscillator suggest a weakening momentum and a bearish sentiment.
- Volatility: The widening Bollinger Bands indicate increased volatility, which could lead to larger price swings.
- Volume: Volume indicators like OBV and CMF show mixed signals, reflecting uncertainty in market participation.
Conclusion:
Based on the analysis of the technical indicators, the stock is likely to experience further downward movement in the next few days. The bearish signals from the trend and momentum indicators, coupled with increased volatility and mixed volume signals, indicate a potential continuation of the current downtrend. Traders and investors should exercise caution and consider risk management strategies in their decision-making process.