Technical Analysis of CZA 2024-05-10
Overview:
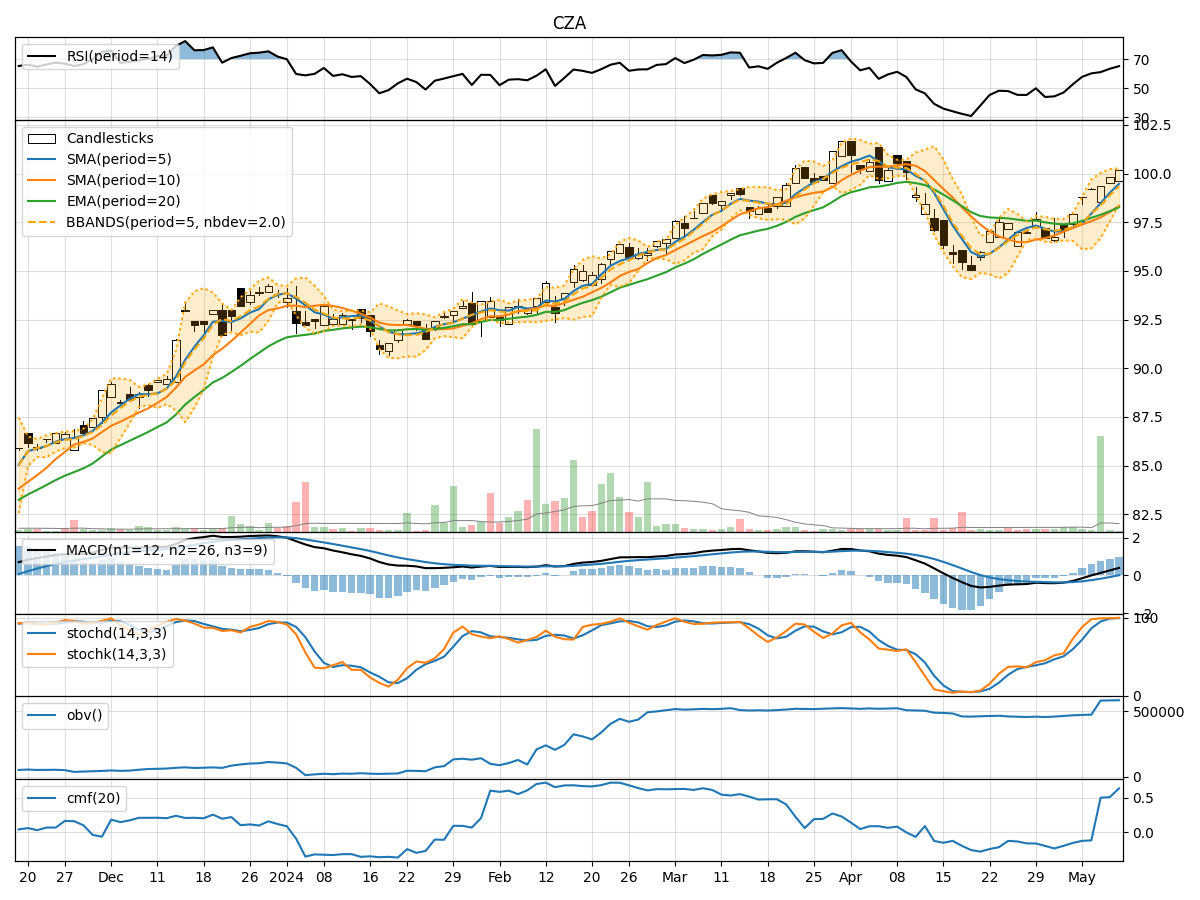
In the last 5 trading days, CZA stock has shown a consistent uptrend in both price and volume. The moving averages have been steadily increasing, and the MACD indicator has been positive. Momentum indicators like RSI and Stochastic oscillators are in overbought territory, indicating strong buying pressure. Volatility has been relatively low, and volume has been increasing, suggesting growing interest in the stock.
Trend Indicators Analysis:
- Moving Averages (MA): The 5-day MA has been consistently above the longer-term SMAs, indicating a short-term bullish trend.
- MACD: The MACD line has been above the signal line, showing positive momentum.
Key Observation: The trend indicators suggest a strong bullish sentiment in the stock.
Momentum Indicators Analysis:
- RSI: RSI has been in the overbought zone, indicating a potential reversal or consolidation.
- Stochastic Oscillators: Both %K and %D have been in the overbought region, signaling a possible pullback.
Key Observation: Momentum indicators suggest a potential short-term correction due to overbought conditions.
Volatility Indicators Analysis:
- Bollinger Bands (BB): The stock price has been trading within the bands, indicating stability.
Key Observation: Volatility is low, suggesting a period of consolidation or sideways movement.
Volume Indicators Analysis:
- On-Balance Volume (OBV): OBV has been steadily increasing, indicating accumulation by investors.
- Chaikin Money Flow (CMF): CMF has been positive, showing buying pressure.
Key Observation: Volume indicators suggest strong buying interest in the stock.
Conclusion:
Based on the technical analysis of trend, momentum, volatility, and volume indicators, the next few days' possible stock price movement for CZA is as follows: - Short-Term: The stock is likely to experience a short-term correction or consolidation due to overbought conditions indicated by momentum indicators. - Medium-Long Term: The overall trend remains bullish, supported by positive moving averages and MACD. Therefore, any pullback is likely to be a buying opportunity for investors looking to enter or add to their positions.
Key Conclusion: Expect a short-term correction followed by a resumption of the bullish trend in the medium to long term.
Always remember to monitor the market closely and adjust your strategy based on real-time data and market developments.