Technical Analysis of DBJP 2024-05-10
Overview:
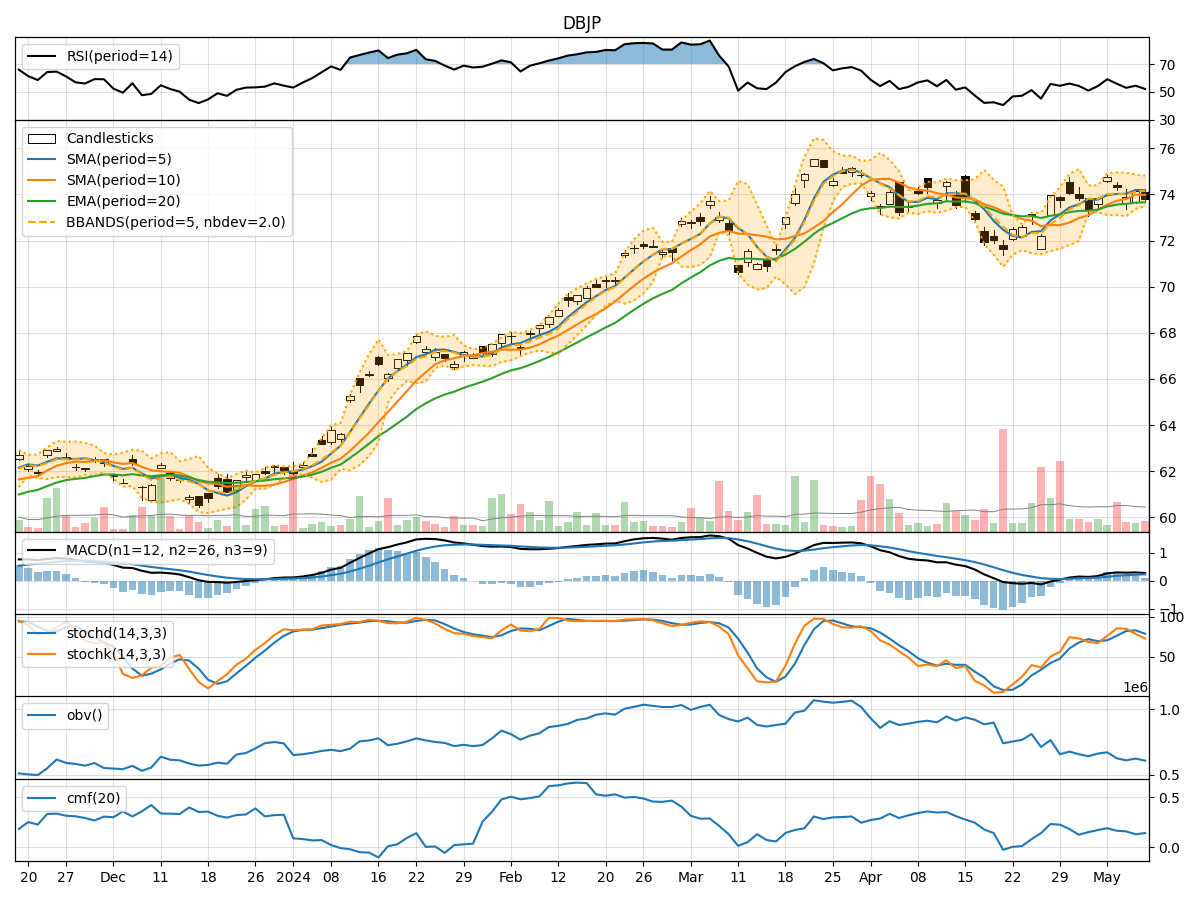
In analyzing the technical indicators for DBJP over the last 5 days, we will delve into the trend, momentum, volatility, and volume indicators to provide a comprehensive outlook on the possible stock price movement. By examining these key aspects, we aim to offer valuable insights and predictions for the upcoming days.
Trend Analysis:
- Moving Averages (MA): The 5-day Moving Average (MA) has been relatively stable around the $74 level, indicating a moderate trend.
- MACD: The MACD line has shown slight fluctuations but has generally remained positive, suggesting a bullish momentum.
- RSI: The Relative Strength Index (RSI) has hovered around the mid-level, indicating a neutral sentiment in terms of momentum.
Key Observation: The trend indicators suggest a neutral to slightly bullish outlook for DBJP.
Momentum Analysis:
- Stochastic Oscillator: The Stochastic Oscillator has shown some variability but has generally been in the overbought territory, signaling a potential reversal.
- Williams %R: The Williams %R indicator has consistently been in the oversold region, indicating a bearish sentiment.
Key Observation: Momentum indicators are mixed, with the Stochastic Oscillator hinting at a possible reversal while the Williams %R suggests a bearish bias.
Volatility Analysis:
- Bollinger Bands (BB): The Bollinger Bands have shown narrowing volatility, with the price trading within the bands, indicating a period of consolidation.
- Average True Range (ATR): ATR has decreased slightly, reflecting reduced volatility in the stock.
Key Observation: Volatility indicators point towards a period of consolidation and reduced price fluctuations.
Volume Analysis:
- On-Balance Volume (OBV): The OBV has shown a slight decline, suggesting some distribution of shares.
- Chaikin Money Flow (CMF): The CMF has also decreased marginally, indicating a slight outflow of money from the stock.
Key Observation: Volume indicators imply a mild bearish sentiment with a decrease in buying pressure.
Conclusion:
Based on the analysis of the technical indicators, the next few days for DBJP could see sideways movement with a slightly bearish bias. The trend indicators suggest a neutral to slightly bullish outlook, while momentum indicators are mixed, leaning towards a bearish sentiment. Volatility indicators point towards consolidation, and volume indicators indicate a mild bearish sentiment.
Overall, the stock is likely to experience sideways trading with a potential downside bias in the near term. Traders should exercise caution and closely monitor key support and resistance levels for potential entry or exit points.