Technical Analysis of DBP 2024-05-10
Overview:
In analyzing the technical indicators for DBP over the last 5 days, we will delve into the trend, momentum, volatility, and volume indicators to provide a comprehensive outlook on the possible stock price movement in the coming days. By examining these key aspects, we aim to offer valuable insights and predictions for informed decision-making.
Trend Analysis:
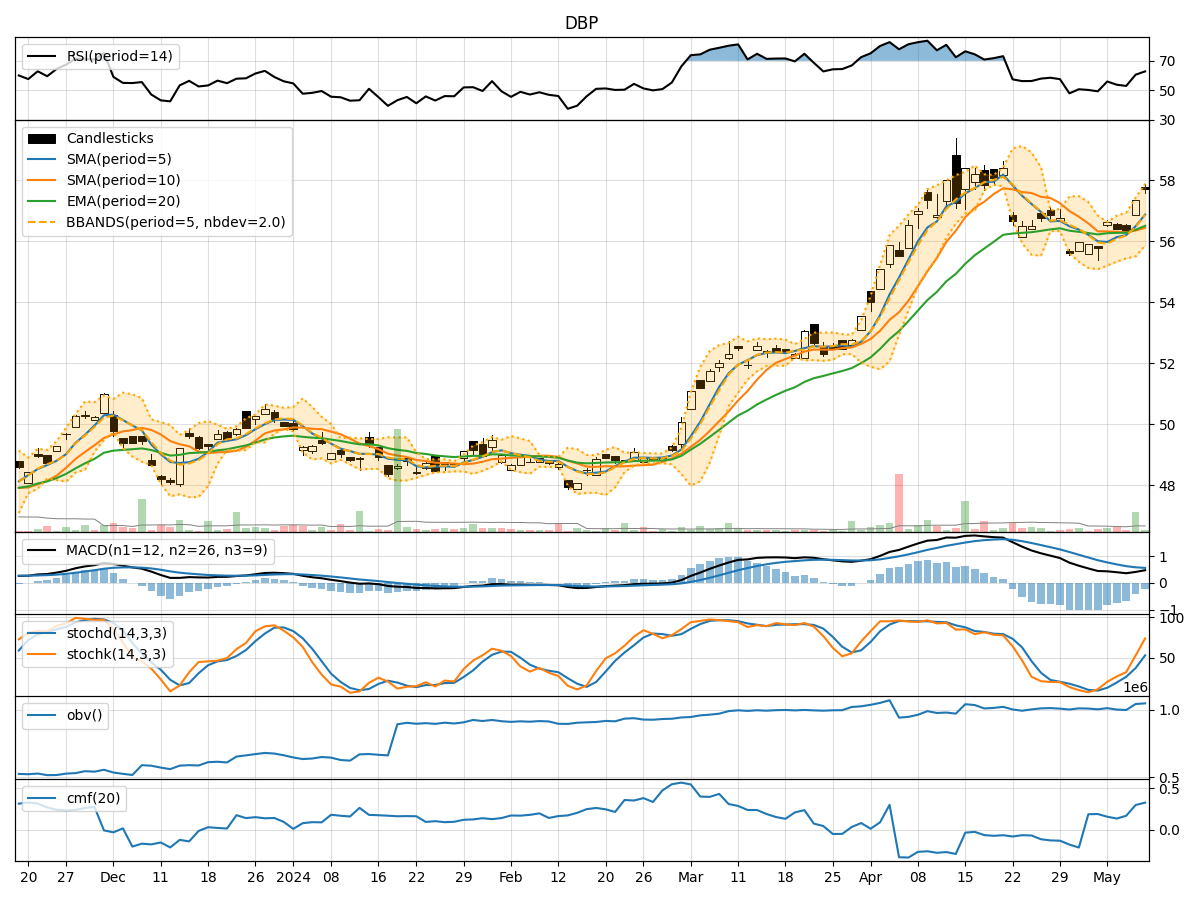
- Moving Averages (MA): The 5-day MA has been consistently above the closing prices, indicating a short-term uptrend.
- MACD: The MACD line has been positive, with the MACD histogram showing a decreasing trend but still above the signal line.
- EMA: The EMA has been gradually increasing, reflecting a bullish sentiment in the stock.
Key Observation: The trend indicators suggest a bullish momentum in the short term.
Momentum Analysis:
- RSI: The RSI has been fluctuating but is currently in the overbought territory, indicating a potential reversal or consolidation.
- Stochastic Oscillator: Both %K and %D have been rising, reaching overbought levels, suggesting a potential pullback.
- Williams %R: The indicator is in the oversold region, signaling a possible reversal in the stock price.
Key Observation: Momentum indicators show mixed signals, with a possibility of a short-term correction.
Volatility Analysis:
- Bollinger Bands: The stock price has been trading within the bands, with the upper band acting as resistance and the lower band as support.
- Bollinger %B: The %B indicator is hovering around 0.9, indicating an overbought condition.
- Average True Range (ATR): The ATR has been relatively stable, suggesting consistent price movements.
Key Observation: Volatility indicators point towards a potential consolidation phase or a minor pullback.
Volume Analysis:
- On-Balance Volume (OBV): The OBV has been increasing, indicating accumulation by investors.
- Chaikin Money Flow (CMF): The CMF is positive, reflecting buying pressure in the stock.
Key Observation: Volume indicators support the bullish sentiment in the stock.
Conclusion:
Based on the analysis of trend, momentum, volatility, and volume indicators, the next few days' possible stock price movement for DBP is likely to experience a short-term correction or consolidation. While the trend indicators suggest a bullish sentiment, the momentum indicators signal a potential pullback, supported by volatility indicators indicating a consolidation phase. However, the positive volume indicators indicate underlying strength in the stock.
Overall View: The stock is likely to experience a short-term correction before potentially resuming its upward trend. Traders should exercise caution and consider profit-taking strategies in the near term.