Technical Analysis of DFE 2024-05-31
Overview:
In the last 5 trading days, the stock price of DFE has shown some fluctuations with varying volumes. We will analyze the technical indicators in the trend, momentum, volatility, and volume categories to determine the possible stock price movement in the next few days.
Trend Analysis:
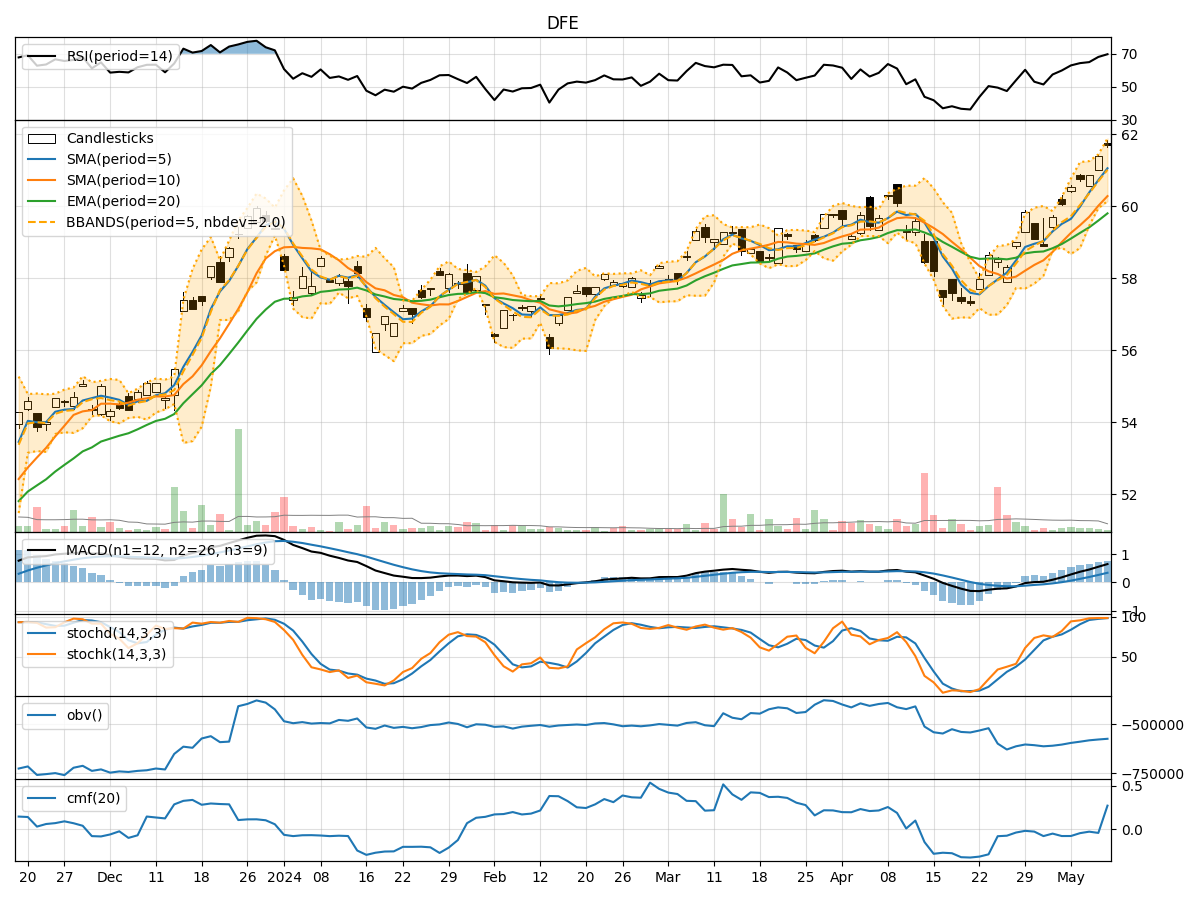
- Moving Averages (MA): The 5-day Moving Average (MA) has been fluctuating around the closing prices, indicating short-term price trends. The Simple Moving Average (SMA) and Exponential Moving Average (EMA) have been relatively close, suggesting stability in the mid-term trend.
- MACD: The Moving Average Convergence Divergence (MACD) has shown positive values, indicating a bullish trend. The MACD Histogram (MACDH) has been mostly positive, supporting the bullish momentum.
Momentum Analysis:
- RSI: The Relative Strength Index (RSI) has been fluctuating but generally staying above 50, indicating bullish momentum.
- Stochastic Oscillator: Both %K and %D have shown fluctuations but have not entered extreme overbought or oversold territories, suggesting a balanced momentum.
- Williams %R: The Williams %R has shown fluctuations but has not reached extreme levels, indicating a neutral momentum.
Volatility Analysis:
- Bollinger Bands (BB): The Bollinger Bands have been widening, indicating increased volatility in the stock price. The bands have not shown significant squeezes, suggesting potential for further price movements.
Volume Analysis:
- On-Balance Volume (OBV): The OBV has been fluctuating, indicating mixed buying and selling pressures.
- Chaikin Money Flow (CMF): The CMF has been negative, indicating a slight distribution phase.
Key Observations:
- The trend indicators suggest a bullish sentiment in the short to mid-term.
- Momentum indicators show a balanced momentum with a slight bullish bias.
- Volatility has increased, indicating potential price movements.
- Volume indicators show mixed buying and selling pressures.
Conclusion:
Based on the analysis of technical indicators, the next few days' possible stock price movement for DFE is likely to be upward with some fluctuations due to increased volatility. The bullish trend and momentum, along with the potential for price movements indicated by volatility, suggest that the stock price may continue to rise in the short term. Traders and investors could consider buying opportunities in anticipation of a potential upward movement in the stock price.