Technical Analysis of DHS 2024-05-10
Overview:
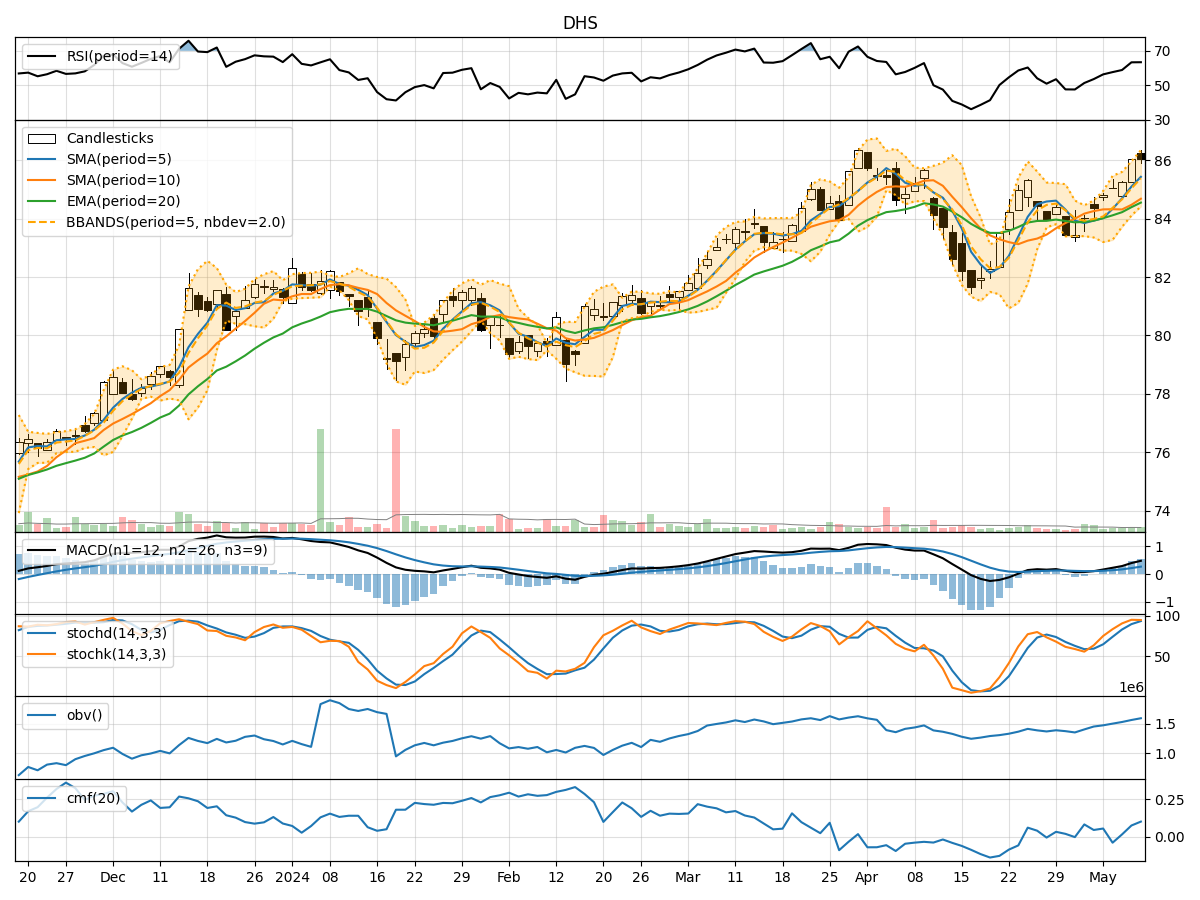
In analyzing the technical indicators for DHS stock over the last 5 days, we will delve into the trend, momentum, volatility, and volume indicators to provide a comprehensive outlook on the possible stock price movement in the coming days.
Trend Analysis:
- Moving Averages (MA): The 5-day Moving Average has been consistently rising, indicating an upward trend in the stock price.
- MACD: The MACD line has been increasing, and the MACD Histogram is also showing positive values, suggesting bullish momentum.
Momentum Analysis:
- RSI: The Relative Strength Index (RSI) has been increasing, indicating strengthening momentum.
- Stochastic Oscillator: Both %K and %D values are high, suggesting the stock is in overbought territory.
Volatility Analysis:
- Bollinger Bands (BB): The stock price has been trading within the upper Bollinger Band, indicating high volatility.
Volume Analysis:
- On-Balance Volume (OBV): The OBV has been steadily increasing, showing accumulation of the stock.
- Chaikin Money Flow (CMF): The CMF is positive, indicating buying pressure in the stock.
Key Observations:
- The stock is in an upward trend based on moving averages and MACD.
- Momentum indicators like RSI and Stochastic Oscillator suggest the stock is overbought.
- Volatility is high as the stock price is trading near the upper Bollinger Band.
- Volume indicators show accumulation and buying pressure in the stock.
Conclusion:
Based on the technical analysis of DHS stock: - The stock is likely to continue its upward movement in the short term. - However, the overbought conditions indicated by momentum indicators suggest a potential pullback or consolidation in the near future. - Traders should be cautious of the high volatility and consider taking profits or implementing risk management strategies. - Long-term investors may consider waiting for a dip to enter or accumulate more shares.
Recommendation:
- Short-term Traders: Consider booking profits or setting tight stop-loss orders to protect gains.
- Long-term Investors: Wait for a potential pullback to enter or accumulate more shares at a better price.
- Monitor the stock closely for any signs of reversal or consolidation in the coming days.
Disclaimer:
This analysis is based solely on technical indicators and historical data. Market conditions can change rapidly, and it is essential to consider other factors before making investment decisions. Consult with a financial advisor for personalized advice tailored to your risk tolerance and investment goals.