Technical Analysis of DIAL 2024-05-10
Overview:
In analyzing the technical indicators for DIAL stock over the last 5 days, we will delve into the trend, momentum, volatility, and volume indicators to provide a comprehensive outlook on the possible future stock price movement. By examining these key indicators, we aim to offer valuable insights and predictions for the upcoming trading days.
Trend Analysis:
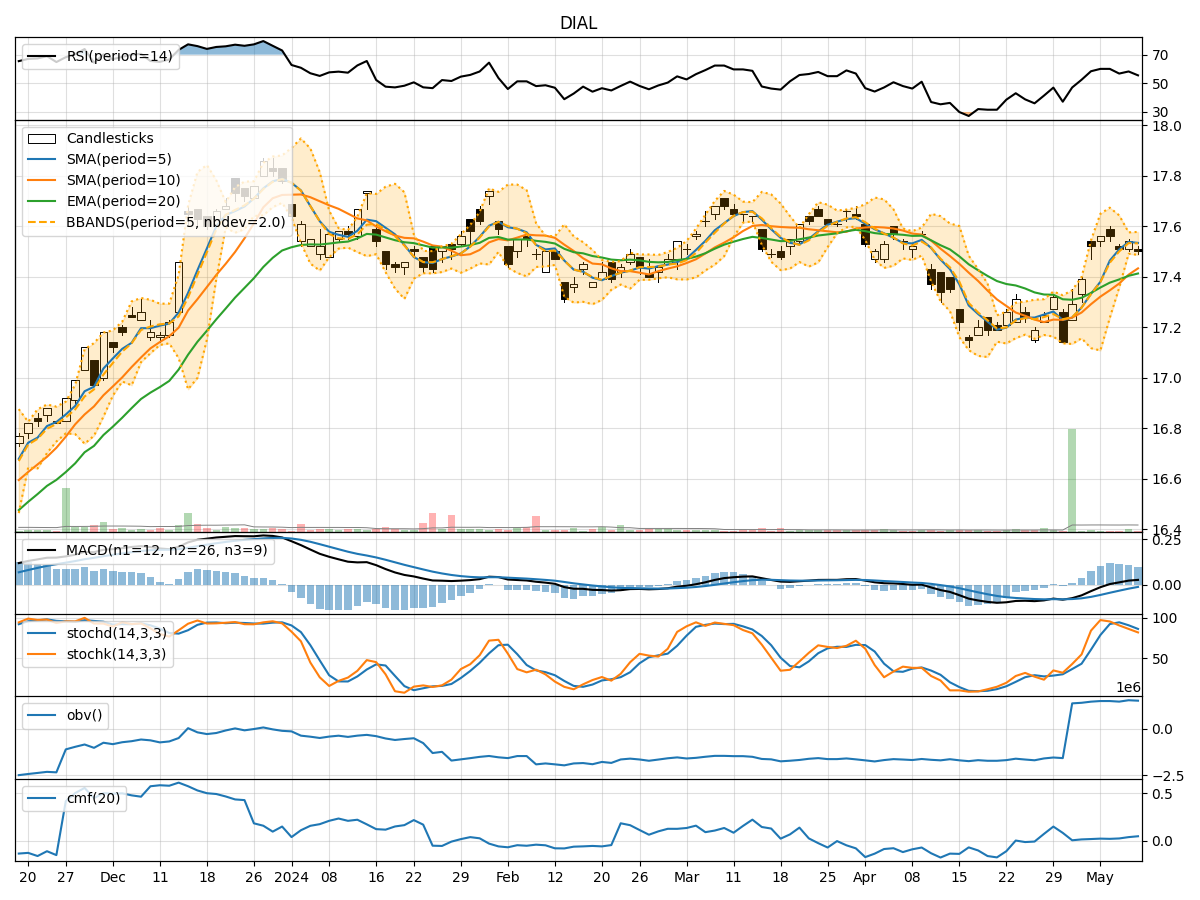
- Moving Averages (MA): The 5-day Moving Average (MA) has been trending slightly above the Simple Moving Average (SMA) and Exponential Moving Average (EMA), indicating a short-term bullish trend.
- MACD: The Moving Average Convergence Divergence (MACD) has been consistently positive, with the MACD line above the signal line, suggesting bullish momentum.
- Conclusion: The trend indicators point towards an upward trend in the stock price.
Momentum Analysis:
- RSI: The Relative Strength Index (RSI) has been fluctuating around the mid-level, indicating neutral momentum.
- Stochastic Oscillator: Both %K and %D have been declining, suggesting a weakening momentum.
- Conclusion: The momentum indicators signal a neutral to slightly bearish sentiment in the stock.
Volatility Analysis:
- Bollinger Bands (BB): The stock price has been trading within the Bollinger Bands, with the bands narrowing, indicating decreasing volatility.
- Conclusion: Volatility indicators suggest a consolidation phase in the stock price.
Volume Analysis:
- On-Balance Volume (OBV): The OBV has shown mixed movements, reflecting indecision among market participants.
- Chaikin Money Flow (CMF): The CMF has been positive, indicating buying pressure in the stock.
- Conclusion: Volume indicators imply a mixed sentiment in the stock.
Conclusion:
Based on the analysis of the technical indicators, the stock is likely to experience sideways movement in the upcoming trading days. The trend indicators point towards an upward bias, while momentum indicators suggest a neutral to slightly bearish sentiment. Volatility indicators indicate a consolidation phase, and volume indicators reflect mixed market participation.
Recommendation:
Considering the overall analysis, it is advisable to monitor the stock closely for any potential breakout or reversal signals. Traders may consider implementing range-bound strategies, while investors should wait for clearer directional cues before making significant decisions. It is crucial to stay updated on market developments and adjust strategies accordingly to navigate the current market conditions effectively.