Technical Analysis of DIG 2024-05-10
Overview:
In analyzing the technical indicators for DIG over the last 5 days, we will delve into the trend, momentum, volatility, and volume indicators to provide a comprehensive outlook on the possible stock price movement in the coming days. By examining these key aspects, we aim to offer valuable insights and predictions to guide investment decisions.
Trend Analysis:
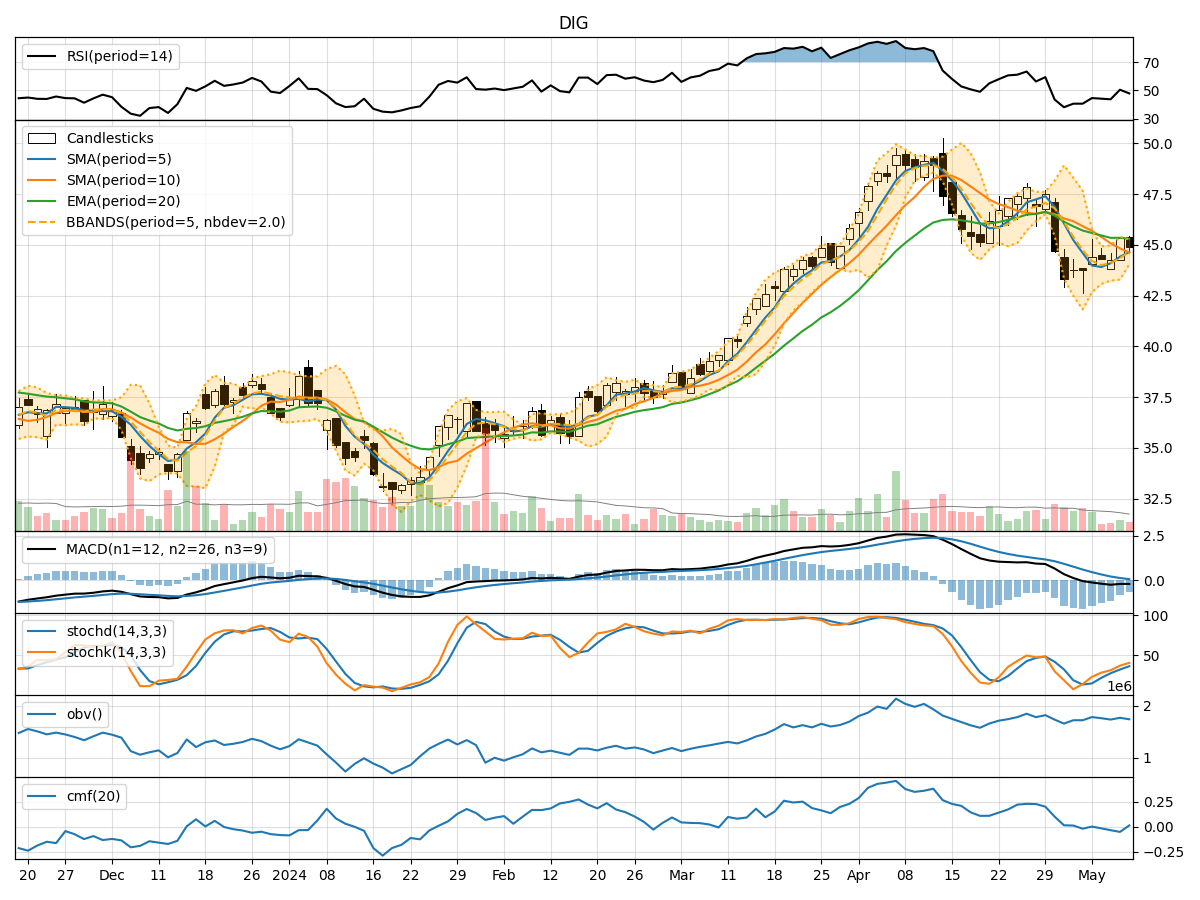
- Moving Averages (MA): The 5-day Moving Average (MA) has been fluctuating around the closing prices, indicating short-term price trends. The Simple Moving Average (SMA) and Exponential Moving Average (EMA) show a downward trend, suggesting a bearish sentiment.
- MACD: The Moving Average Convergence Divergence (MACD) has been negative, with the MACD line consistently below the signal line. This indicates a bearish momentum in the stock price.
- Conclusion: The trend indicators suggest a bearish outlook for the stock in the short term.
Momentum Analysis:
- RSI: The Relative Strength Index (RSI) has shown mixed signals, starting from oversold levels and moving towards neutral territory. This indicates a lack of strong momentum in either direction.
- Stochastic Oscillator: Both %K and %D lines of the Stochastic Oscillator have been rising but remain below the overbought threshold. This suggests a potential for upward movement but not a strong bullish momentum.
- Conclusion: The momentum indicators imply a neutral to slightly bullish sentiment for the stock.
Volatility Analysis:
- Bollinger Bands (BB): The Bollinger Bands have been narrowing, indicating decreasing volatility in the stock price. The bands are currently close to the moving average, suggesting a period of consolidation.
- Conclusion: The volatility indicators point towards a consolidation phase for the stock.
Volume Analysis:
- On-Balance Volume (OBV): The OBV has shown a slight decrease, indicating some selling pressure in the stock. However, the Chaikin Money Flow (CMF) remains close to zero, reflecting a balance between buying and selling pressure.
- Conclusion: The volume indicators suggest a neutral stance in terms of buying and selling pressure.
Overall Conclusion:
Based on the analysis of the trend, momentum, volatility, and volume indicators, the next few days for DIG are likely to see sideways movement with a slight bearish bias. The trend indicators signal a bearish sentiment, while the momentum indicators show a neutral to slightly bullish outlook. Volatility indicators point towards a consolidation phase, and volume indicators indicate a balanced buying and selling pressure.
Recommendation:
Considering the overall analysis, it is advisable to exercise caution in trading DIG in the coming days. Traders may consider waiting for clearer signals or confirmation of a trend before making significant investment decisions. It is essential to monitor the price action closely and be prepared to adapt to changing market conditions.
By combining insights from various technical indicators and understanding the interplay of market dynamics, investors can make more informed decisions and navigate the stock market with greater confidence.