Technical Analysis of DJCB 2024-05-10
Overview:
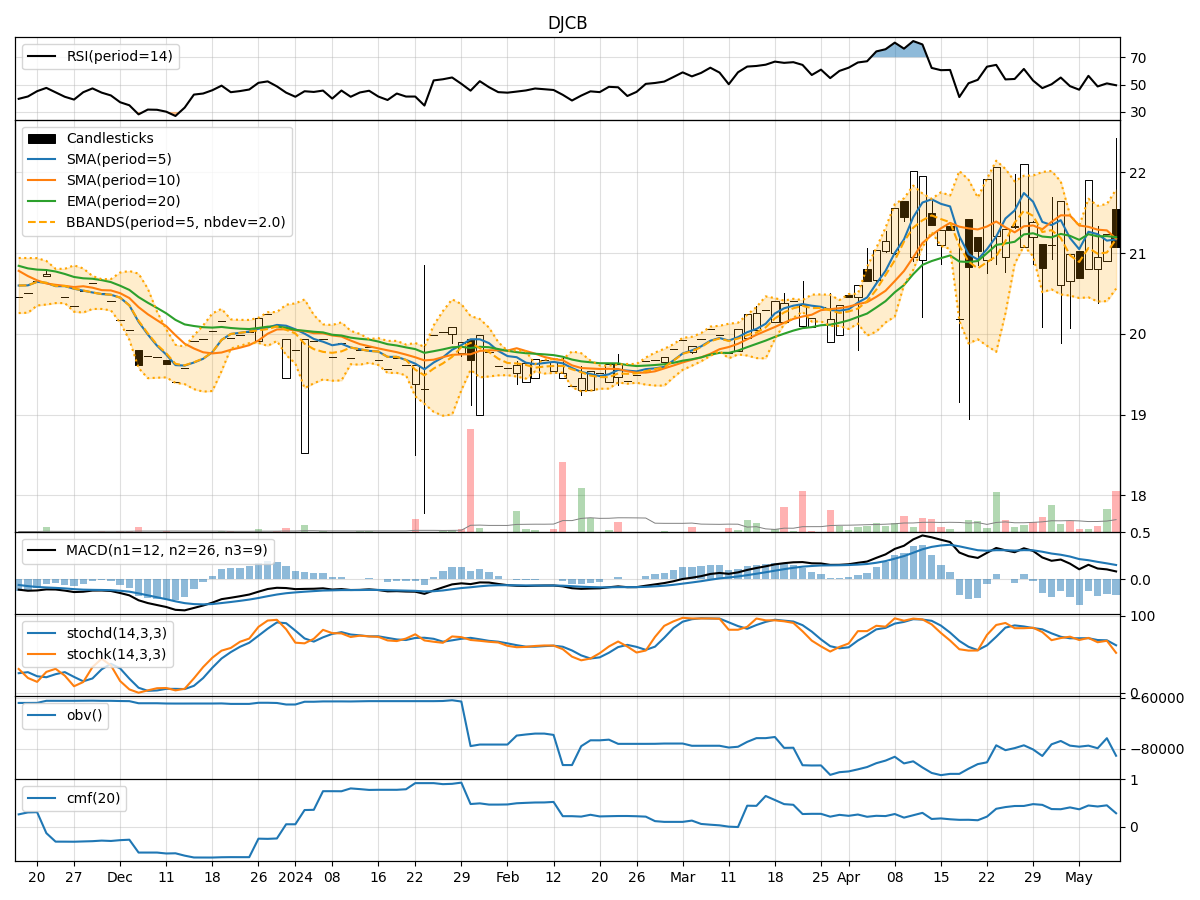
In the last 5 trading days, DJCB stock has shown mixed signals across various technical indicators. The trend indicators suggest a neutral to slightly bearish sentiment, with the Moving Average Convergence Divergence (MACD) showing a decreasing trend. Momentum indicators also indicate a lack of strong buying or selling pressure. Volatility indicators show relatively stable price movements, while volume indicators suggest a slight decrease in buying pressure.
Trend Indicators:
- Moving Averages (MA): The 5-day Moving Average (MA) is below the 10-day Simple Moving Average (SMA), indicating a short-term bearish trend. The Exponential Moving Average (EMA) is also showing a slight downward trend.
- MACD: The MACD line is decreasing, and the MACD Histogram is also showing a declining trend, indicating weakening bullish momentum.
Momentum Indicators:
- RSI: The Relative Strength Index (RSI) is hovering around the neutral zone, suggesting a lack of strong buying or selling pressure.
- Stochastic Oscillator: Both %K and %D lines of the Stochastic Oscillator are below 50, indicating a potential bearish momentum.
- Williams %R: The Williams %R is in the oversold territory, suggesting a possible reversal or consolidation.
Volatility Indicators:
- Bollinger Bands: The Bollinger Bands are relatively narrow, indicating low volatility and a potential period of consolidation.
- Bollinger %B: The %B is below 1, suggesting that the price is trading below the lower Bollinger Band, indicating a possible oversold condition.
Volume Indicators:
- On-Balance Volume (OBV): The OBV has shown a slight decrease over the last 5 days, indicating a decrease in buying pressure.
- Chaikin Money Flow (CMF): The CMF is positive but trending downwards, suggesting weakening buying pressure.
Conclusion:
Based on the analysis of the technical indicators, the next few days for DJCB stock are likely to see sideways movement with a slight bearish bias. The trend indicators point towards a neutral to bearish sentiment, while momentum indicators suggest a lack of strong buying pressure. Volatility indicators indicate a period of consolidation, and volume indicators show a decrease in buying pressure.
Key Points: - Trend: Neutral to slightly bearish - Momentum: Lack of strong buying pressure - Volatility: Low with a potential consolidation phase - Volume: Decrease in buying pressure
Therefore, it is advisable to exercise caution in trading DJCB stock in the next few days, as the overall outlook leans towards a sideways movement with a bearish bias.