Technical Analysis of DPST 2024-05-03
Overview:
In analyzing the technical indicators for DPST over the last 5 days, we will delve into the trend, momentum, volatility, and volume indicators to provide a comprehensive outlook on the possible stock price movement in the coming days. By examining these key aspects, we aim to offer valuable insights and predictions for informed decision-making.
Trend Analysis:
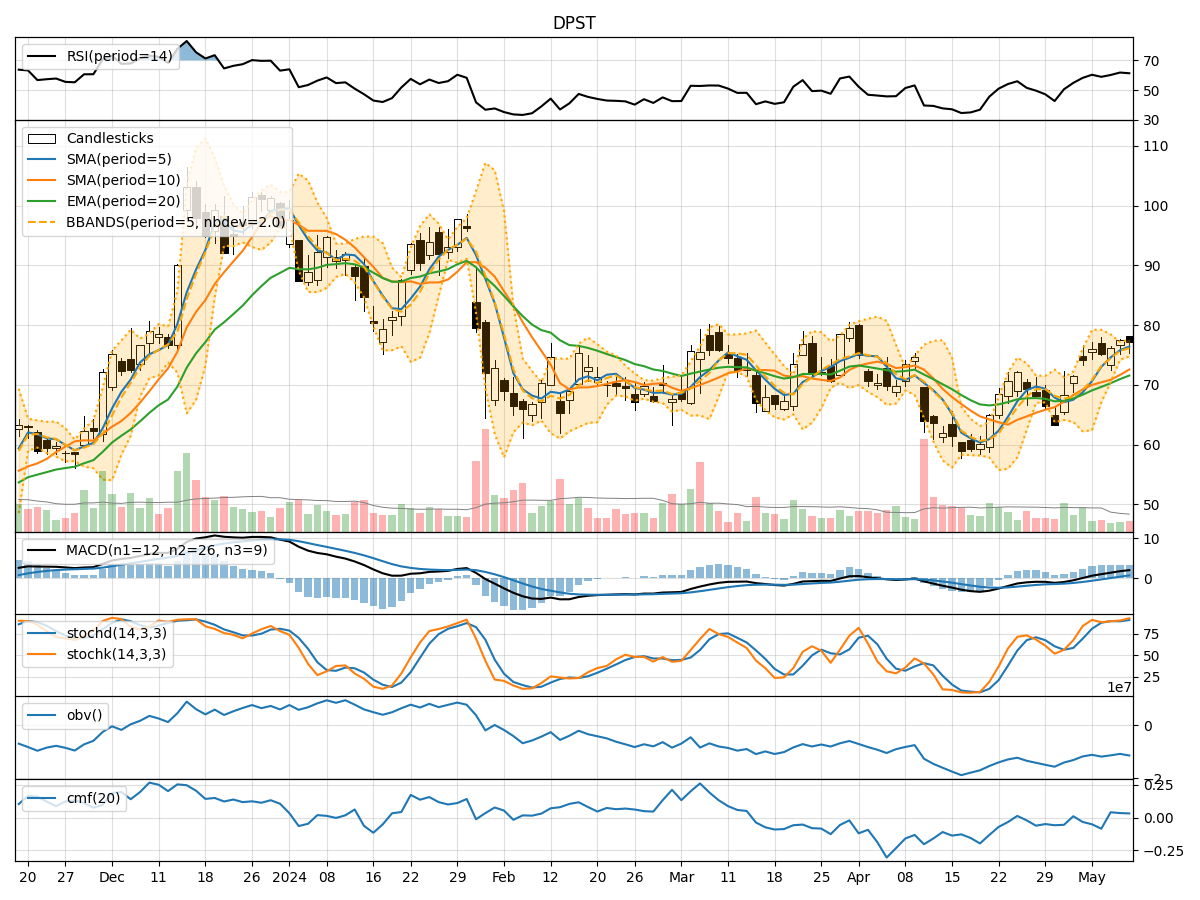
- Moving Averages (MA): The 5-day Moving Average (MA) has been fluctuating around the actual stock prices, indicating short-term price trends. The Simple Moving Average (SMA) and Exponential Moving Average (EMA) show a mixed trend, with the EMA slightly lagging behind.
- MACD: The Moving Average Convergence Divergence (MACD) has been negative but showing signs of convergence towards the signal line, suggesting a potential reversal in the short term.
- MACD Histogram: The MACD Histogram is gradually decreasing but still positive, indicating a slowing momentum in the bullish trend.
Momentum Analysis:
- RSI: The Relative Strength Index (RSI) has been increasing, reaching the overbought territory, signaling a potential reversal or consolidation.
- Stochastic Oscillator: Both %K and %D lines of the Stochastic Oscillator are in the overbought zone, indicating a possible pullback in the stock price.
- Williams %R: The Williams %R is also in the oversold region, suggesting a bearish sentiment in the market.
Volatility Analysis:
- Bollinger Bands (BB): The Bollinger Bands are widening, indicating increased volatility in the stock price. The current price is closer to the upper band, suggesting a potential reversal or correction.
- Bollinger %B: The %B indicator is above 0.8, signifying an overbought condition and a possible price reversal.
Volume Analysis:
- On-Balance Volume (OBV): The OBV has been declining, indicating selling pressure in the market.
- Chaikin Money Flow (CMF): The CMF is negative, suggesting a bearish sentiment among investors.
Conclusion:
Based on the analysis of the technical indicators, the stock of DPST is likely to experience a short-term correction or consolidation in the coming days. The overbought conditions in the RSI, Stochastic Oscillator, and Williams %R, coupled with the negative OBV and CMF, indicate a potential reversal in the bullish trend. Traders should exercise caution and consider taking profits or implementing risk management strategies in anticipation of a downward price movement.
Key Takeaways:
- Bearish Bias: The indicators point towards a bearish sentiment in the market.
- Potential Reversal: Overbought conditions and negative volume indicators suggest a possible reversal in the stock price.
- Risk Management: Traders should consider implementing risk management strategies to protect their positions in the face of increased volatility and selling pressure.
By carefully monitoring these indicators and market dynamics, investors can make well-informed decisions to navigate the upcoming price movements in DPST effectively.