Technical Analysis of DRV 2024-05-10
Overview:
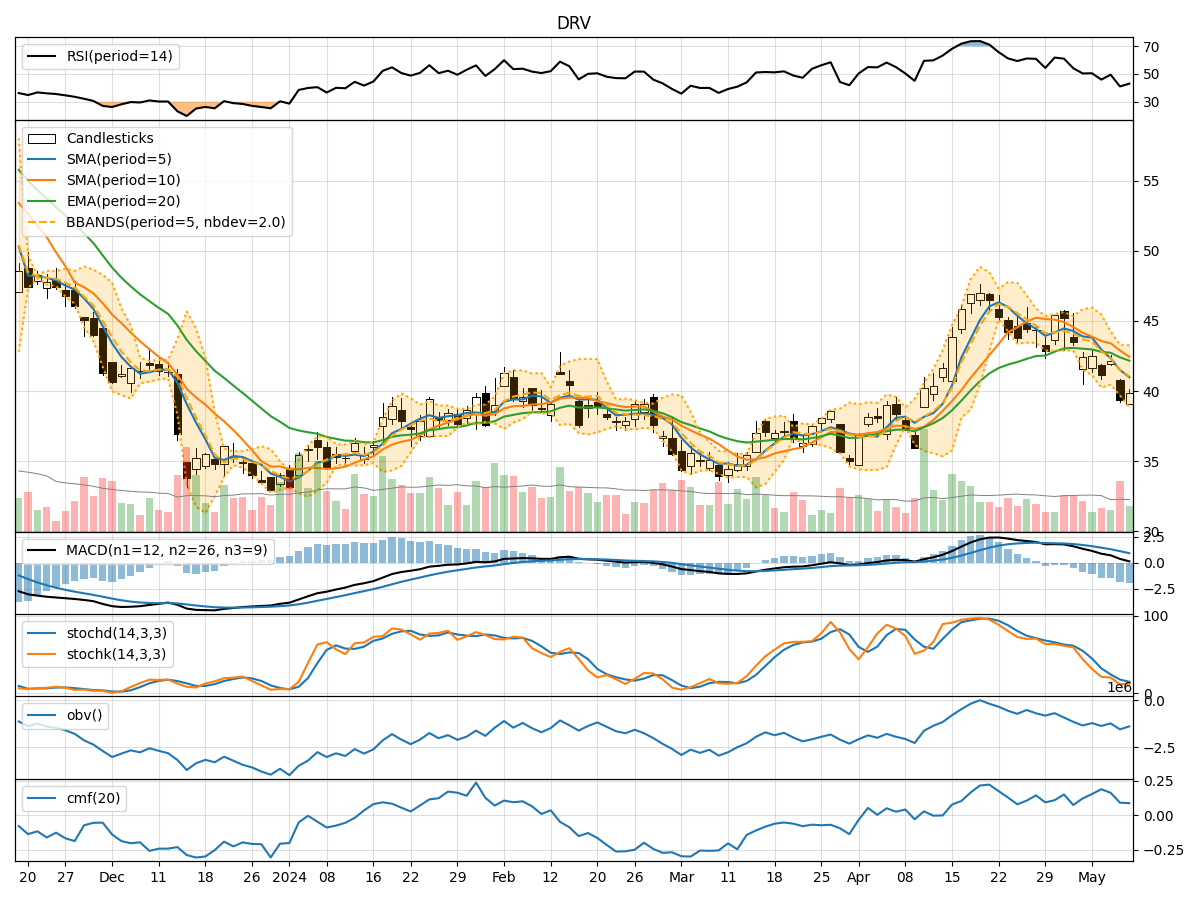
In analyzing the technical indicators for DRV over the last 5 days, we will delve into the trend, momentum, volatility, and volume indicators to provide a comprehensive outlook on the possible stock price movement in the coming days.
Trend Analysis:
- Moving Averages (MA): The 5-day Moving Average (MA) has been consistently below the Simple Moving Average (SMA) and Exponential Moving Average (EMA) over the past 5 days, indicating a downward trend.
- MACD: The Moving Average Convergence Divergence (MACD) has been negative, with the MACD line consistently below the signal line, suggesting bearish momentum.
Momentum Analysis:
- RSI: The Relative Strength Index (RSI) has been fluctuating around the 50 level, indicating a lack of strong momentum in either direction.
- Stochastic Oscillator: Both %K and %D have been in oversold territory, suggesting a potential reversal in the near future.
Volatility Analysis:
- Bollinger Bands (BB): The stock price has been trading below the middle Bollinger Band (BBM), indicating a bearish sentiment.
Volume Analysis:
- On-Balance Volume (OBV): The OBV has been declining, indicating selling pressure in the stock.
- Chaikin Money Flow (CMF): The CMF has been relatively low, suggesting a lack of strong buying interest.
Key Observations:
- The trend indicators, momentum indicators, and volatility indicators all point towards a bearish sentiment in the stock.
- The volume indicators also support the bearish view, with declining OBV and low CMF values.
- The stock is currently in a downtrend, with negative momentum and low buying interest.
Conclusion:
Based on the analysis of the technical indicators, the next few days' possible stock price movement for DRV is likely to be downward. Traders and investors should exercise caution and consider short-term selling opportunities or wait for a clear reversal signal before considering long positions. The overall outlook for DRV appears bearish, and it is advisable to closely monitor the indicators for any signs of a trend reversal before making any trading decisions.