Technical Analysis of DUST 2024-05-03
Overview:
In analyzing the technical indicators for DUST over the last 5 days, we will delve into the trend, momentum, volatility, and volume indicators to provide a comprehensive outlook on the possible stock price movement. By examining these key aspects, we aim to offer valuable insights and predictions for the upcoming days.
Trend Indicators:
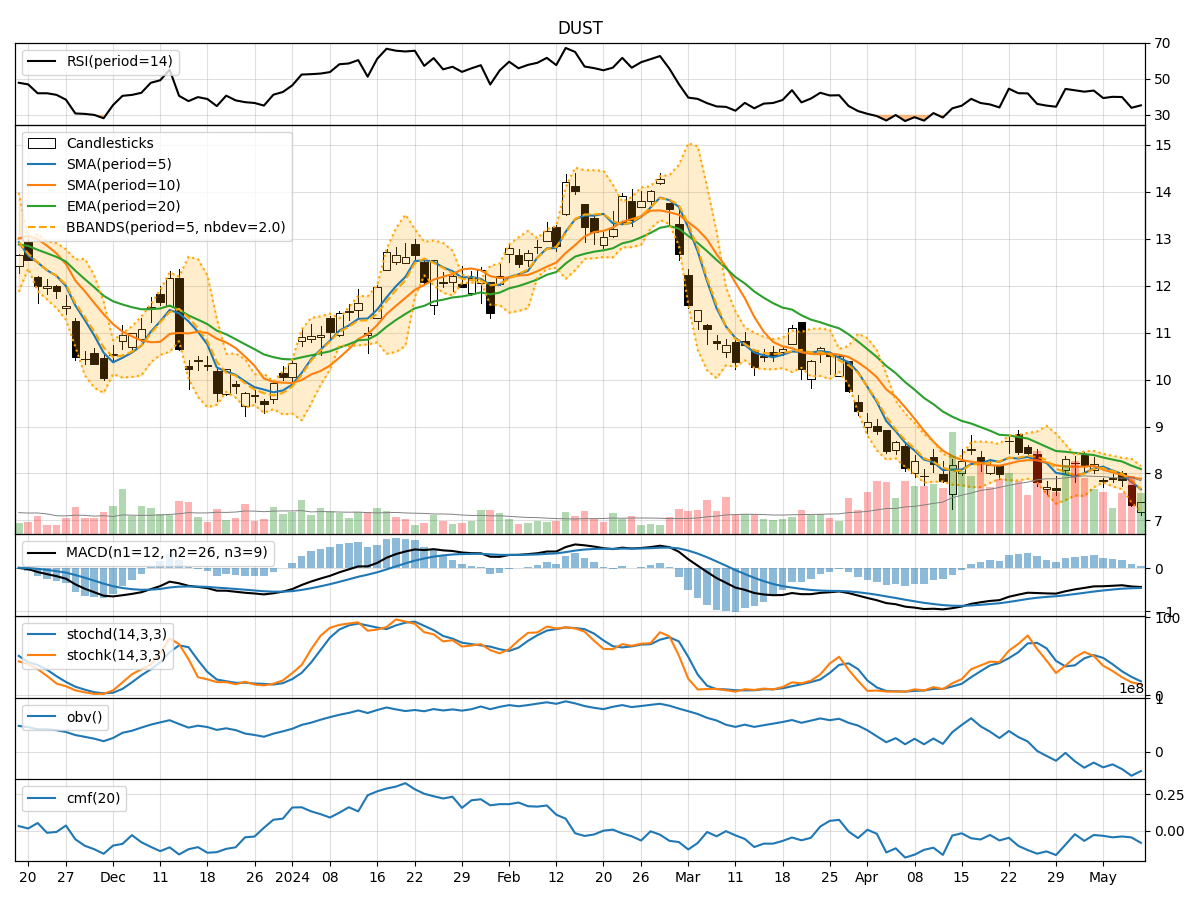
- Moving Averages (MA): The 5-day MA has been fluctuating around the closing prices, indicating short-term price trends. The SMA(10) and EMA(20) show a downward trend, suggesting a bearish sentiment in the medium to long term.
- MACD and Signal Line: The MACD has been negative, with the MACD line consistently below the signal line, indicating a bearish trend.
- MACD Histogram: The histogram has been decreasing, further confirming the bearish momentum.
Momentum Indicators:
- RSI (14): The RSI has been below 50, indicating bearish momentum in the stock.
- Stochastic Oscillator: Both %K and %D have been trending downwards, suggesting a bearish sentiment.
- Williams %R: The indicator has been in the oversold territory, signaling a potential reversal or continuation of the downtrend.
Volatility Indicators:
- Bollinger Bands: The bands have been narrowing, indicating decreasing volatility in the stock price.
- Bollinger %B: The %B has been below 1, suggesting the stock is trading below the lower band, potentially indicating an oversold condition.
Volume Indicators:
- On-Balance Volume (OBV): The OBV has been consistently negative, indicating selling pressure in the stock.
- Chaikin Money Flow (CMF): The CMF has been negative, reflecting a bearish sentiment in the stock.
Key Observations and Opinions:
- Trend: The trend indicators suggest a bearish outlook in both the short and medium to long term.
- Momentum: Momentum indicators align with the bearish sentiment, indicating a potential continuation of the downtrend.
- Volatility: Decreasing volatility may lead to a period of consolidation or a potential reversal.
- Volume: The negative OBV and CMF signal ongoing selling pressure in the stock.
Conclusion:
Based on the analysis of the technical indicators, the next few days for DUST are likely to see further downward movement. The bearish trend, supported by momentum and volume indicators, suggests that the stock price may continue its decline. Traders and investors should exercise caution and consider shorting or avoiding long positions until a clear reversal pattern emerges.