Technical Analysis of EIDO 2024-05-10
Overview:
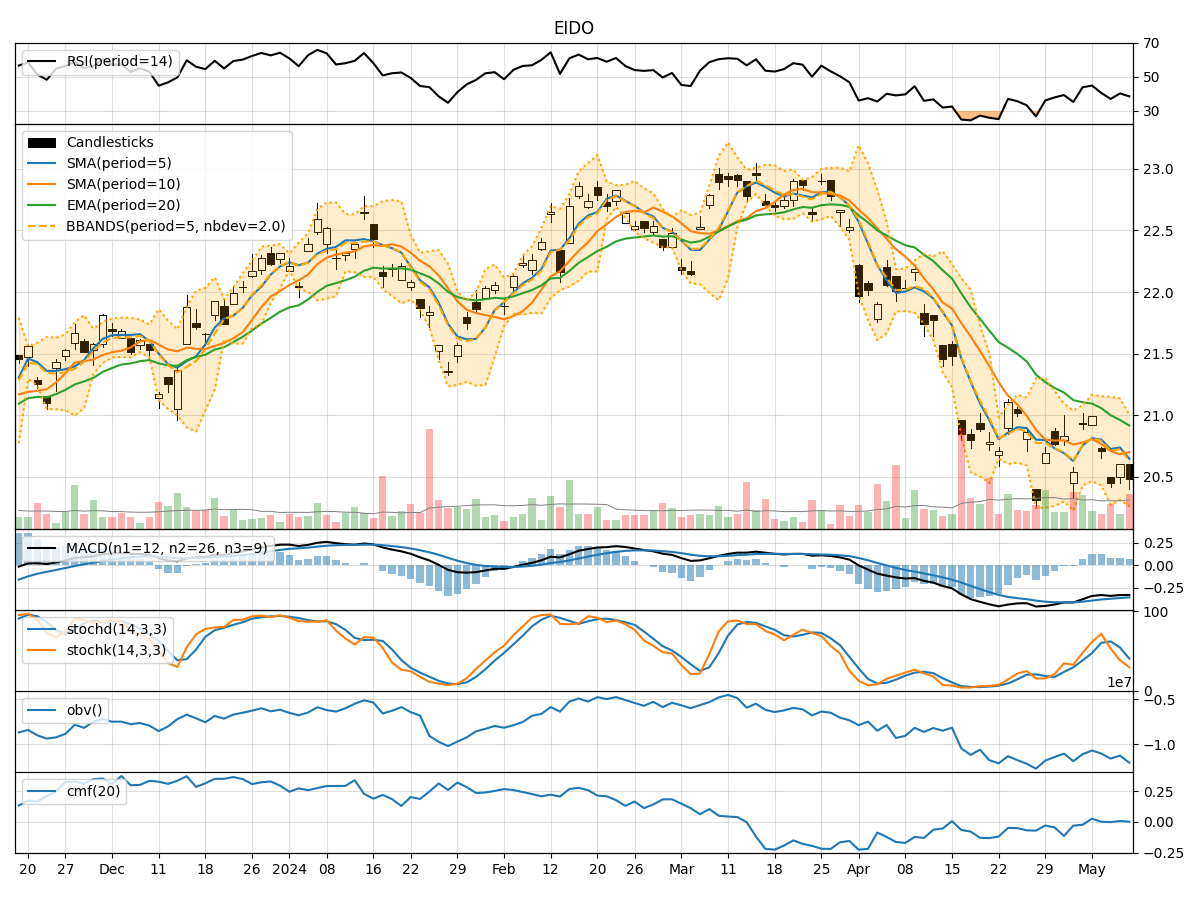
In analyzing the technical indicators for EIDO over the last 5 days, we will delve into the trend, momentum, volatility, and volume indicators to provide a comprehensive outlook on the possible stock price movement in the coming days.
Trend Analysis:
- Moving Averages (MA): The 5-day Moving Average (MA) has been gradually decreasing, indicating a short-term bearish trend.
- MACD: The MACD line has been consistently below the signal line, suggesting a bearish momentum in the stock.
- EMA: The Exponential Moving Average (EMA) has also been declining, further supporting the bearish sentiment in the short term.
Momentum Analysis:
- RSI: The Relative Strength Index (RSI) has been hovering around the mid-level, indicating a neutral momentum in the stock.
- Stochastic Oscillator: Both %K and %D have been decreasing, signaling a bearish momentum.
- Williams %R: The Williams %R is in the oversold territory, suggesting a potential reversal or bounce in the stock price.
Volatility Analysis:
- Bollinger Bands: The Bollinger Bands have been narrowing, indicating decreasing volatility in the stock.
- Bollinger %B: The %B indicator is below 0.5, suggesting the stock is trading below the lower Bollinger Band, potentially indicating an oversold condition.
Volume Analysis:
- On-Balance Volume (OBV): The OBV has been consistently decreasing, indicating a bearish volume flow in the stock.
- Chaikin Money Flow (CMF): The CMF has been slightly negative, suggesting a slight outflow of money from the stock.
Key Observations:
- The trend indicators, including moving averages and MACD, point towards a bearish sentiment in the short term.
- Momentum indicators like RSI and Stochastic Oscillator also support the bearish outlook.
- Volatility has been decreasing, potentially signaling a period of consolidation or a lack of significant price movements.
- Volume indicators show a bearish volume flow, indicating a lack of strong buying interest in the stock.
Conclusion:
Based on the analysis of the technical indicators, the outlook for EIDO in the next few days is bearish. The stock is likely to experience further downward pressure, potentially leading to a continuation of the current downtrend. Traders and investors should exercise caution and consider short-term selling strategies or wait for a more favorable entry point before considering long positions.