Technical Analysis of EMB 2024-05-10
Overview:
In analyzing the technical indicators for EMB over the last 5 days, we will delve into the trend, momentum, volatility, and volume indicators to provide a comprehensive outlook on the possible stock price movement in the coming days. By examining key metrics such as moving averages, MACD, RSI, Bollinger Bands, and OBV, we aim to offer valuable insights and recommendations for potential trading strategies.
Trend Indicators:
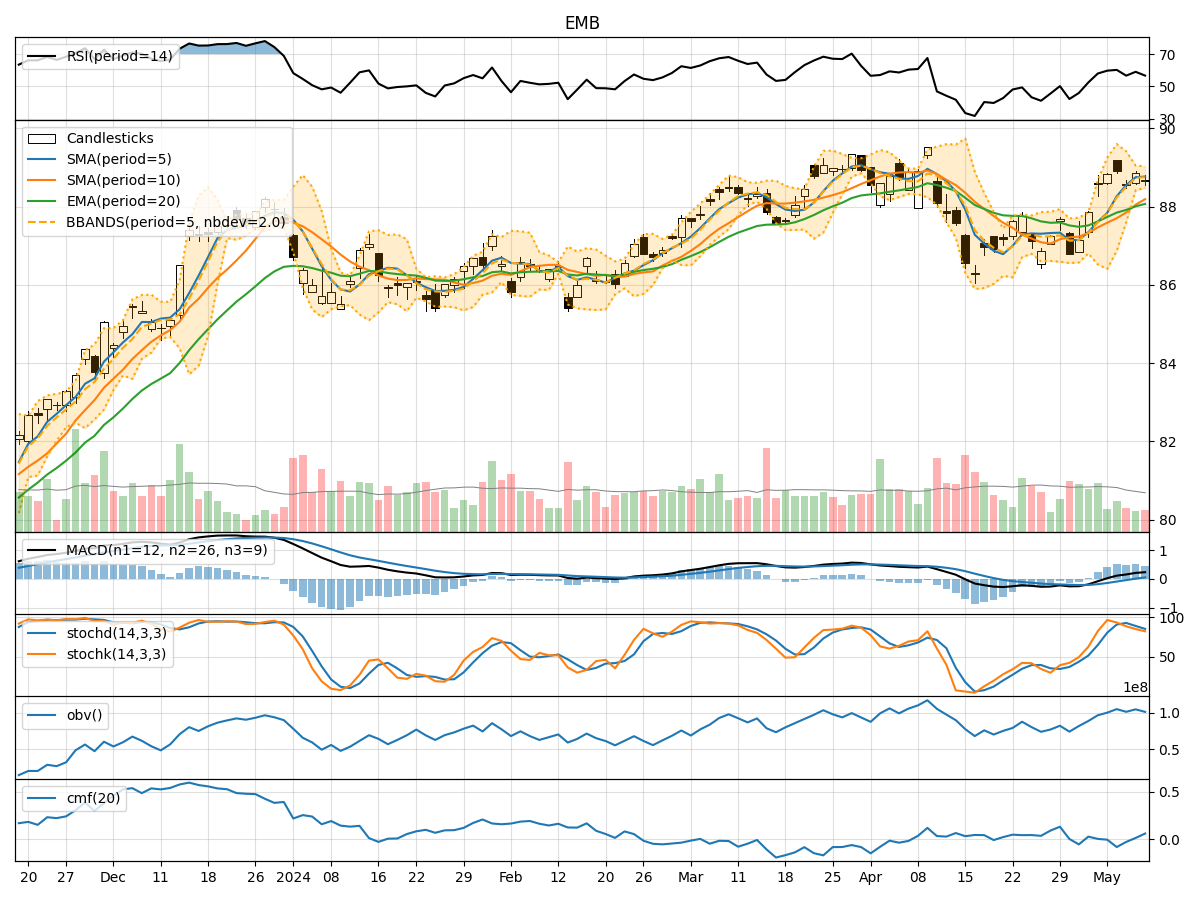
- Moving Averages (MA): The 5-day MA has been consistently above the closing prices, indicating a short-term uptrend.
- MACD: The MACD line has been trending upwards, with the MACD histogram showing positive values, suggesting bullish momentum.
- EMA: The EMA has been steadily increasing, supporting the bullish trend.
Momentum Indicators:
- RSI: The RSI has been fluctuating around the 50 level, indicating a neutral momentum.
- Stochastic Oscillator: Both %K and %D have been declining, signaling a potential reversal in momentum.
- Williams %R: The indicator has been hovering in the oversold territory, suggesting a possible buying opportunity.
Volatility Indicators:
- Bollinger Bands (BB): The stock price has been trading within the bands, indicating a period of consolidation.
- BB Width: The narrowing of the bands suggests decreasing volatility.
Volume Indicators:
- On-Balance Volume (OBV): The OBV has shown mixed signals, reflecting indecision among market participants.
- Chaikin Money Flow (CMF): The CMF has been negative, indicating selling pressure in the market.
Key Observations:
- The trend indicators point towards a bullish bias, supported by the moving averages and MACD.
- Momentum indicators suggest a neutral to slightly bearish sentiment, with the RSI hovering around the midpoint.
- Volatility indicators indicate a period of consolidation, with decreasing price fluctuations.
- Volume indicators show mixed signals, with OBV reflecting uncertainty and CMF signaling selling pressure.
Conclusion:
Based on the analysis of the technical indicators, the next few days for EMB could see sideways movement with a slight bearish bias. Traders may consider waiting for clearer signals from momentum and volume indicators before making significant trading decisions. It is essential to monitor key levels such as support and resistance to gauge the stock's potential direction. Overall, a cautious approach is recommended until a clearer trend emerges in the market.