Technical Analysis of EMBD 2024-05-10
Overview:
In analyzing the technical indicators for EMBD over the last 5 days, we will delve into the trend, momentum, volatility, and volume indicators to provide a comprehensive outlook on the possible stock price movement in the coming days. By examining these key aspects, we aim to offer valuable insights and recommendations for potential investors.
Trend Indicators:
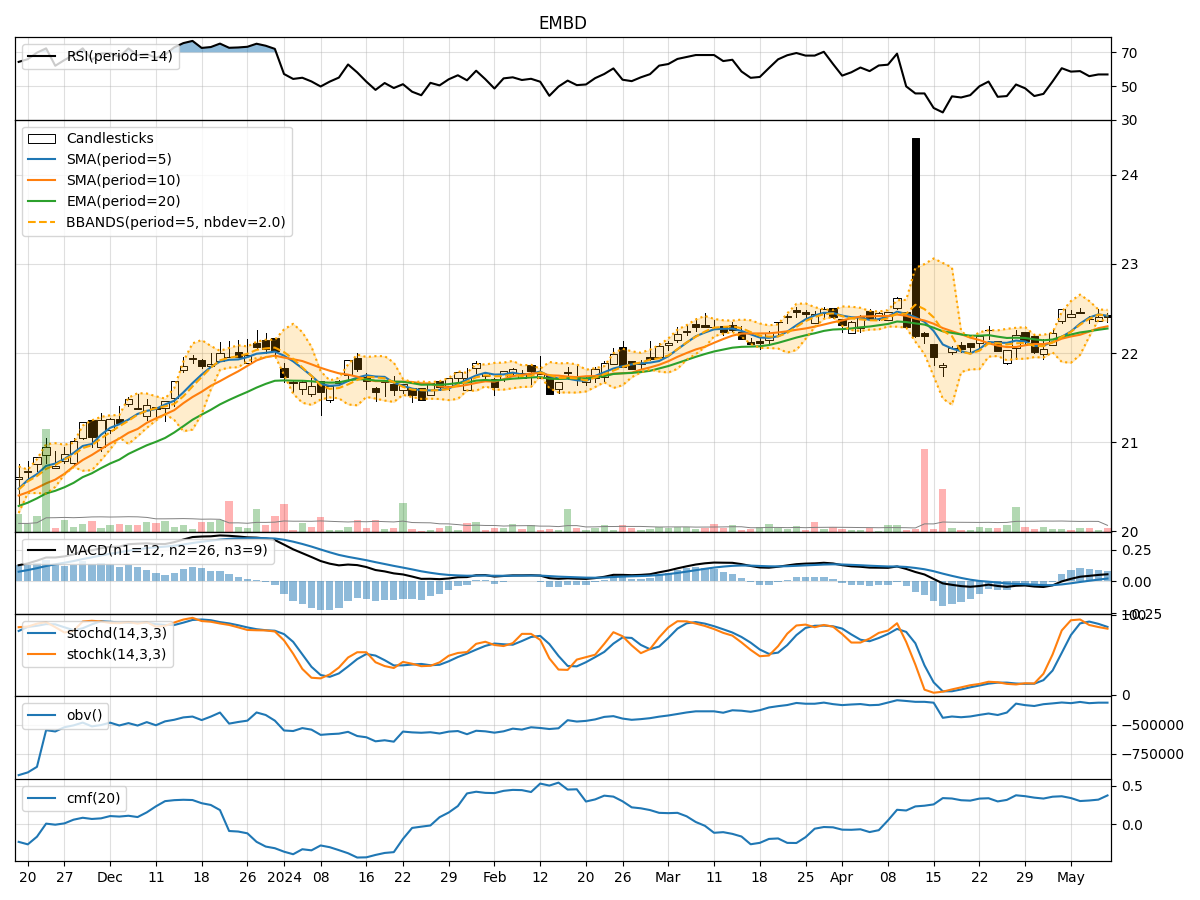
- Moving Averages (MA): The 5-day MA has been consistently above the closing prices, indicating a short-term uptrend.
- MACD: The MACD line has been trending upwards, with the MACD histogram showing positive values, suggesting bullish momentum.
- EMA: The EMA has been steadily increasing, reflecting a positive trend in the stock price.
Momentum Indicators:
- RSI: The RSI has been hovering around the neutral zone, indicating a balanced momentum in the stock.
- Stochastic Oscillator: Both %K and %D have been declining but remain in the overbought territory, suggesting a potential reversal or consolidation phase.
- Williams %R: The Williams %R is in the oversold region, indicating a possible buying opportunity.
Volatility Indicators:
- Bollinger Bands (BB): The bands have been narrowing, indicating decreasing volatility and a potential price breakout in the near future.
- BB %B: The %B indicator is hovering around the middle range, suggesting a balanced market sentiment.
- Average True Range (ATR): The ATR has been relatively stable, indicating consistent price movements.
Volume Indicators:
- On-Balance Volume (OBV): The OBV has shown mixed signals, with volume not confirming the recent price movements.
- Chaikin Money Flow (CMF): The CMF has been positive, indicating buying pressure in the stock.
Key Observations:
- The trend indicators suggest a bullish sentiment in the short term.
- Momentum indicators show a mixed picture, with potential signs of a reversal or consolidation.
- Volatility indicators point towards a potential breakout in price.
- Volume indicators indicate a lack of confirmation for recent price movements.
Conclusion:
Based on the analysis of the technical indicators, the next few days' possible stock price movement for EMBD is likely to experience a period of consolidation. The bullish trend may pause or undergo a minor correction before potentially resuming its upward trajectory. Investors should closely monitor key support and resistance levels for potential entry or exit points. It is advisable to exercise caution and wait for clearer signals before making significant trading decisions.