Technical Analysis of EMNT 2024-05-10
Overview:
In analyzing the technical indicators for EMNT stock over the last 5 days, we will delve into the trend, momentum, volatility, and volume indicators to provide a comprehensive outlook on the possible future stock price movement. By examining these key aspects, we aim to offer valuable insights and predictions for the upcoming trading days.
Trend Analysis:
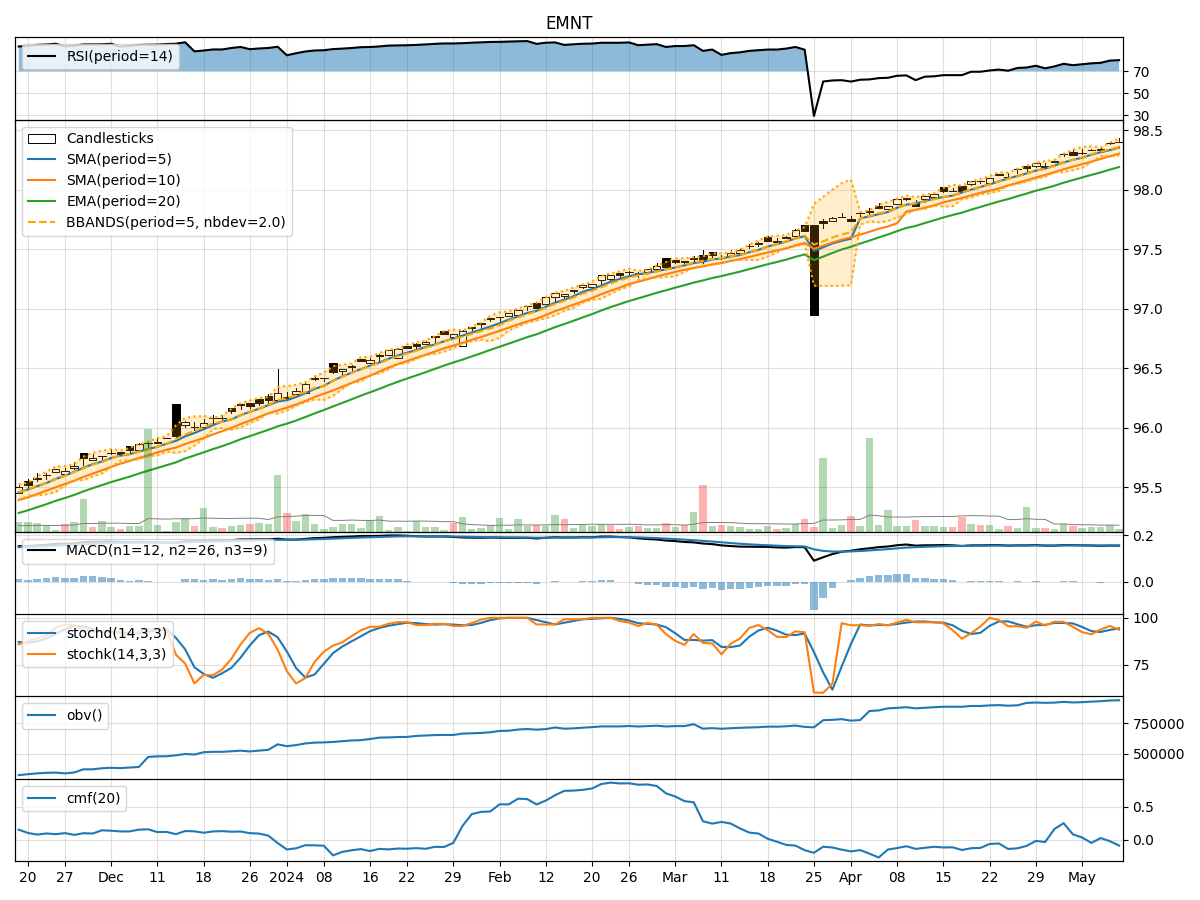
- Moving Averages (MA): The 5-day Moving Average (MA) has been consistently above the Simple Moving Average (SMA) and Exponential Moving Average (EMA), indicating a bullish trend.
- MACD: The MACD line has been positive, with the MACD Histogram mostly above the signal line, suggesting bullish momentum.
Momentum Analysis:
- RSI: The Relative Strength Index (RSI) has been in the overbought territory, indicating a strong bullish momentum.
- Stochastic Oscillator: Both %K and %D have been relatively high, signaling an overbought condition.
Volatility Analysis:
- Bollinger Bands (BB): The stock price has mostly stayed within the Bollinger Bands, with the bands narrowing, suggesting decreasing volatility.
- Bollinger %B: The %B indicator has been fluctuating around the middle band, indicating a neutral stance.
Volume Analysis:
- On-Balance Volume (OBV): The OBV has shown a slight increase over the last 5 days, suggesting some accumulation.
- Chaikin Money Flow (CMF): The CMF has been negative, indicating some selling pressure in the stock.
Key Observations:
- The trend indicators point towards a bullish sentiment, supported by the positive MACD and moving averages.
- Momentum indicators reflect a strong bullish momentum, as seen in the overbought RSI and Stochastic Oscillator.
- Volatility has been decreasing, as indicated by the narrowing Bollinger Bands, suggesting a potential period of consolidation.
- Volume indicators show mixed signals, with OBV slightly increasing but CMF indicating selling pressure.
Conclusion:
Based on the analysis of the technical indicators, the stock is likely to continue its upward movement in the next few days. The bullish trend, strong momentum, and decreasing volatility support this outlook. However, the mixed signals from volume indicators suggest some caution, as there might be intermittent selling pressure. Traders and investors should closely monitor the price action and volume dynamics to capitalize on potential opportunities while managing risks effectively.