Technical Analysis of EQLS 2024-05-10
Overview:
In analyzing the technical indicators for EQLS over the last 5 days, we will delve into the trend, momentum, volatility, and volume indicators to provide a comprehensive outlook on the possible stock price movement. By examining these key factors, we aim to offer valuable insights and predictions for the upcoming days.
Trend Analysis:
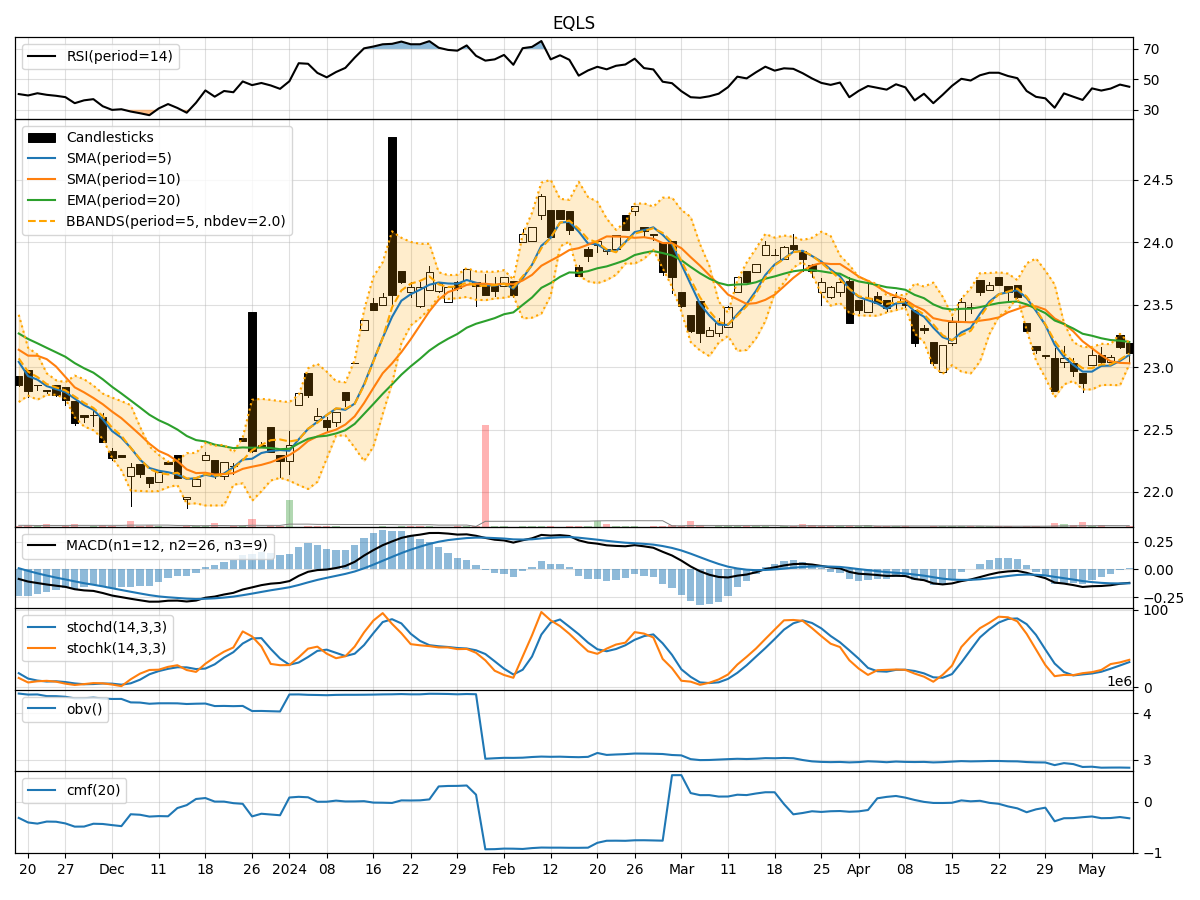
- Moving Averages (MA): The 5-day MA has been fluctuating around the closing prices, indicating a lack of clear trend direction.
- MACD: The MACD line has been consistently below the signal line, suggesting a bearish momentum in the short term.
Momentum Analysis:
- RSI: The RSI values have been hovering around the mid-range, indicating a neutral sentiment with no extreme overbought or oversold conditions.
- Stochastic Oscillator: Both %K and %D values have been gradually increasing, reflecting a potential bullish momentum building up.
Volatility Analysis:
- Bollinger Bands (BB): The stock price has been trading within the bands, with the %B indicator showing a slight deviation from the upper band.
Volume Analysis:
- On-Balance Volume (OBV): The OBV values have been fluctuating, suggesting indecision among market participants.
- Chaikin Money Flow (CMF): The CMF values have been negative, indicating a lack of buying pressure in the market.
Key Observations:
- The trend indicators show a lack of clear direction, with the MACD signaling a bearish bias.
- Momentum indicators suggest a potential shift towards bullish momentum, as indicated by the rising Stochastic values.
- Volatility remains relatively stable within the Bollinger Bands, with a slight deviation towards the upper band.
- Volume indicators reflect a neutral sentiment, with OBV fluctuating and CMF indicating a lack of significant buying pressure.
Conclusion:
Based on the analysis of the technical indicators, the next few days for EQLS could see sideways movement with a slight bullish bias. While the trend indicators are inconclusive, the momentum indicators hint at a potential bullish momentum building up. Volatility is relatively stable, and volume indicators suggest a neutral stance. Traders may consider monitoring the Stochastic values for confirmation of a bullish trend and exercise caution in the absence of a clear trend direction.