Technical Analysis of ERX 2024-05-10
Overview:
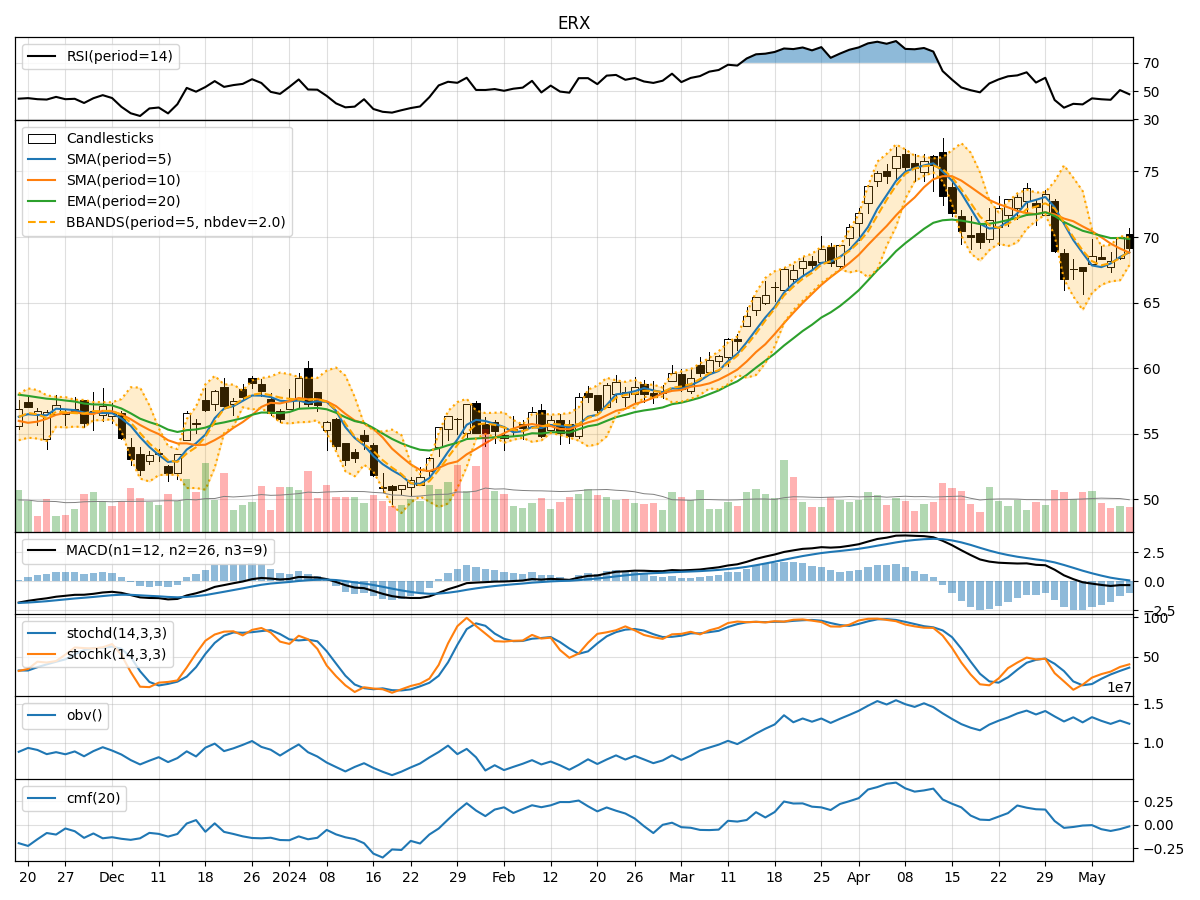
In the last 5 trading days, ERX has shown mixed signals across various technical indicators. The stock price has fluctuated within a range, with some indicators suggesting potential weakness while others hint at possible strength. By analyzing trend, momentum, volatility, and volume indicators, we can gain a comprehensive understanding of the stock's potential future movements.
Trend Analysis:
- Moving Averages (MA): The 5-day MA has been below the 10-day SMA, indicating a short-term bearish trend. However, the EMA(20) has been relatively flat, suggesting a lack of strong trend direction.
- MACD: The MACD line has been consistently below the signal line, indicating bearish momentum. The MACD histogram has been decreasing, signaling a potential weakening of downward momentum.
Momentum Analysis:
- RSI: The RSI has been fluctuating around the 50 level, indicating a lack of strong momentum in either direction.
- Stochastic Oscillator: Both %K and %D have been rising, suggesting a potential bullish momentum shift. However, they are not yet in overbought territory.
Volatility Analysis:
- Bollinger Bands (BB): The stock price has been trading within the bands, indicating normal volatility. The bands have not shown any significant expansion or contraction.
- Bollinger %B: The %B indicator has been hovering around 0.5, suggesting the stock is trading at the middle of the bands.
Volume Analysis:
- On-Balance Volume (OBV): The OBV has been relatively flat, indicating a balance between buying and selling pressure.
- Chaikin Money Flow (CMF): The CMF has been negative, suggesting a slight outflow of money from the stock.
Conclusion:
Based on the analysis of technical indicators: - Trend: The short-term trend is bearish, but the lack of strong trend direction indicates potential consolidation. - Momentum: The momentum is neutral to slightly bullish, with a possibility of a bullish shift in the near term. - Volatility: Volatility is normal, with no significant signals of impending large price movements. - Volume: The volume indicators suggest a balance between buying and selling pressure.
Overall Opinion:
Considering the mixed signals from the technical indicators, the next few days for ERX could see sideways movement with a slight bullish bias. Traders may expect the stock price to consolidate within the current range, potentially with a slight upward drift. However, it is crucial to monitor key levels and wait for confirmation from leading indicators before making trading decisions.