Technical Analysis of ESGB 2024-05-10
Overview:
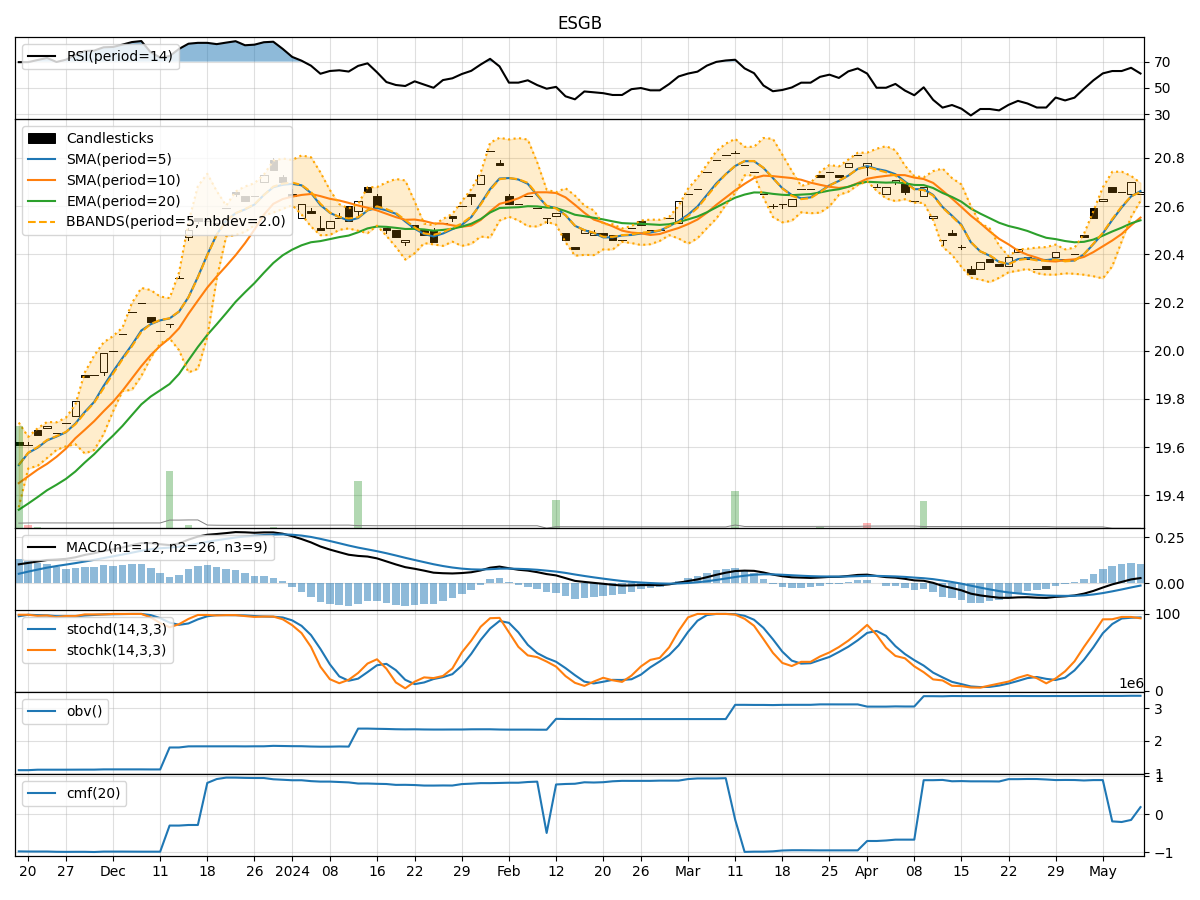
In analyzing the technical indicators for ESGB stock over the last 5 days, we will delve into the trend, momentum, volatility, and volume indicators to provide a comprehensive outlook on the possible stock price movement in the coming days.
Trend Analysis:
- Moving Averages (MA): The 5-day Moving Average has been consistently above the Simple Moving Average (SMA) and Exponential Moving Average (EMA), indicating a bullish trend.
- MACD: The MACD line has been consistently above the signal line, with both lines showing an upward trend, suggesting bullish momentum.
- RSI: The Relative Strength Index (RSI) has been fluctuating around the overbought territory, indicating strong buying pressure.
Momentum Analysis:
- Stochastic Oscillator: Both %K and %D lines of the Stochastic Oscillator have been in the overbought zone, suggesting a potential reversal or consolidation.
- Williams %R: The Williams %R has been hovering in the oversold territory, indicating a possible buying opportunity.
Volatility Analysis:
- Bollinger Bands: The stock price has been trading within the Bollinger Bands, with the bands narrowing, indicating decreasing volatility.
- Average True Range (ATR): ATR has been relatively stable, suggesting consistent price movements.
Volume Analysis:
- On-Balance Volume (OBV): The OBV has been fluctuating, indicating mixed buying and selling pressure.
- Chaikin Money Flow (CMF): The CMF has been negative, suggesting outflow of money from the stock.
Key Observations:
- The trend indicators suggest a bullish sentiment with moving averages and MACD signaling upward momentum.
- Momentum indicators show conflicting signals with Stochastic Oscillator in the overbought zone and Williams %R in the oversold territory.
- Volatility indicators point towards decreasing volatility, potentially leading to a period of consolidation.
- Volume indicators reflect mixed sentiment with OBV fluctuating and CMF indicating negative money flow.
Conclusion:
Based on the analysis of technical indicators, the stock price of ESGB is likely to experience sideways movement or consolidation in the coming days. The bullish trend indicated by moving averages and MACD may face resistance due to conflicting signals from momentum indicators. Decreasing volatility suggests a period of stability, while mixed volume indicators indicate a lack of clear direction in buying or selling pressure. Traders should exercise caution and wait for clearer signals before making significant trading decisions.