Technical Analysis of EWJ 2024-05-10
Overview:
In analyzing the technical indicators for EWJ over the last 5 days, we will delve into the trend, momentum, volatility, and volume indicators to provide a comprehensive outlook on the possible stock price movement in the coming days. By examining these key indicators, we aim to offer valuable insights and predictions for potential investors.
Trend Indicators:
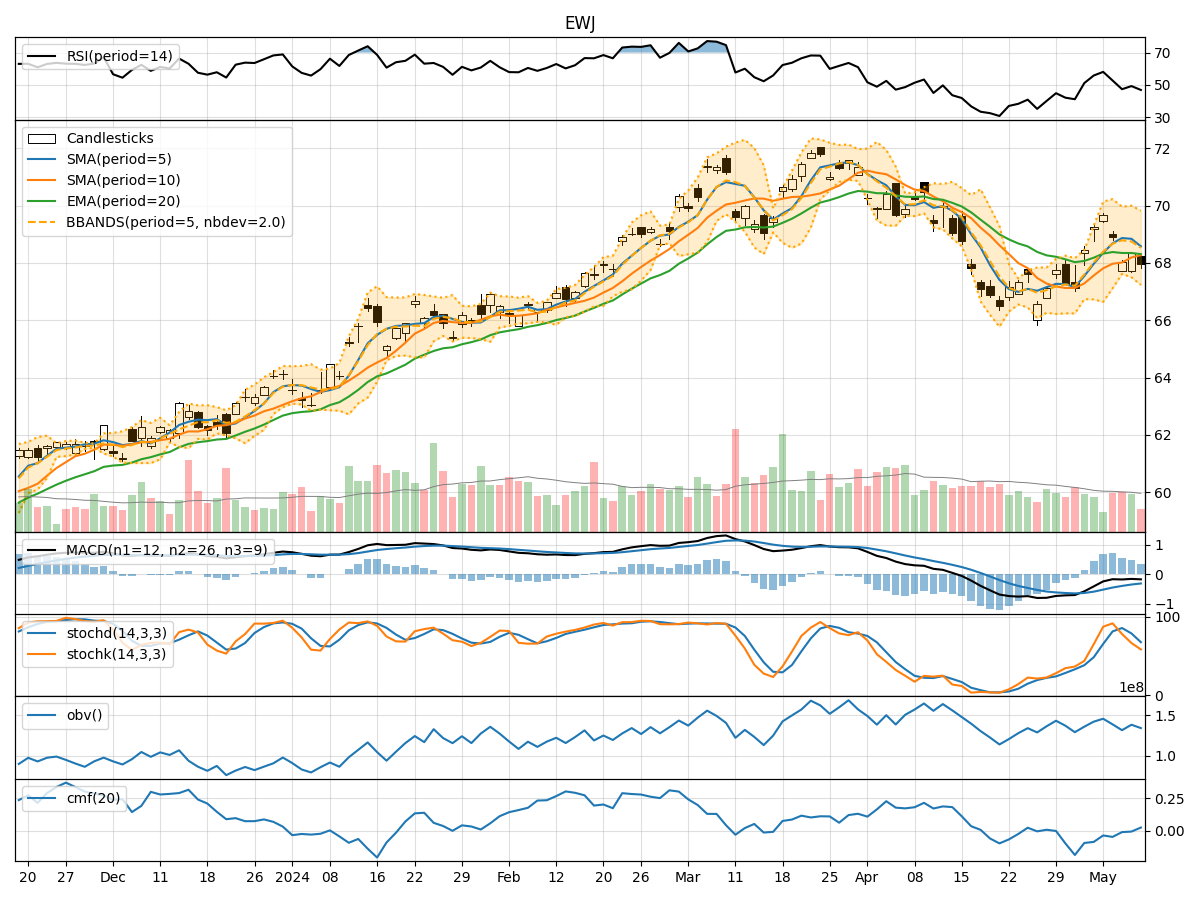
- Moving Averages (MA): The 5-day Moving Average (MA) has been fluctuating around the actual closing prices, indicating a lack of clear trend direction.
- MACD: The Moving Average Convergence Divergence (MACD) has been consistently negative, suggesting a bearish momentum in the short term.
- MACD Histogram: The MACD Histogram has been decreasing, indicating a weakening bearish momentum.
Momentum Indicators:
- RSI: The Relative Strength Index (RSI) has been hovering around the mid-range, indicating a neutral momentum.
- Stochastic Oscillator: Both %K and %D of the Stochastic Oscillator have been declining, signaling a bearish momentum.
- Williams %R: The Williams %R has been in the oversold territory, suggesting a potential reversal or bounce.
Volatility Indicators:
- Bollinger Bands: The Bollinger Bands have been narrowing, indicating decreasing volatility and a potential upcoming breakout.
- Bollinger %B: The %B indicator has been fluctuating within a tight range, suggesting a period of consolidation.
Volume Indicators:
- On-Balance Volume (OBV): The OBV has been fluctuating, indicating a balance between buying and selling pressure.
- Chaikin Money Flow (CMF): The CMF has been negative, suggesting a net outflow of money from the stock.
Key Observations and Opinions:
- Trend: The trend indicators show a lack of clear direction, with a slight bearish bias indicated by the MACD.
- Momentum: Momentum indicators suggest a bearish sentiment in the short term, with potential for a reversal indicated by the oversold Williams %R.
- Volatility: Volatility has been decreasing, hinting at a potential period of consolidation before a breakout.
- Volume: Volume indicators show a balance between buying and selling pressure, with a slight negative bias indicated by the CMF.
Conclusion:
Based on the analysis of the technical indicators, the next few days for EWJ are likely to see further downward movement in the stock price. The bearish momentum indicated by the MACD and Stochastic Oscillator, coupled with the lack of clear trend direction and negative CMF, suggest a potential continuation of the current downtrend. Traders should exercise caution and consider short-term bearish strategies until a clear reversal signal is observed.