Technical Analysis of EWU 2024-05-10
Overview:
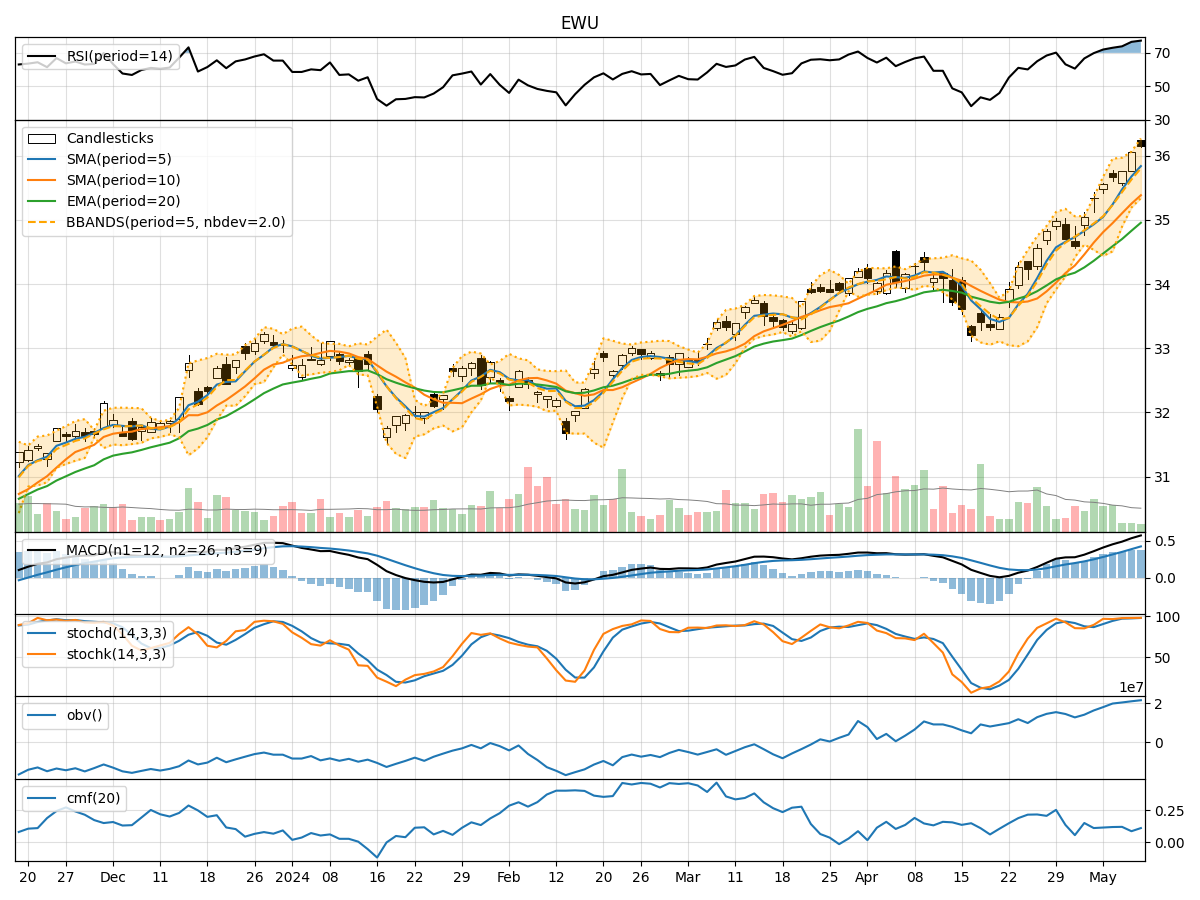
In analyzing the technical indicators for EWU over the last 5 days, we will delve into the trend, momentum, volatility, and volume indicators to provide a comprehensive outlook on the possible stock price movement in the coming days.
Trend Analysis:
- Moving Averages (MA): The 5-day Moving Average (MA) has been consistently rising, indicating a bullish trend in the short term.
- MACD: The MACD line has been above the signal line for all 5 days, suggesting a bullish momentum.
- EMA: The Exponential Moving Average (EMA) has also been trending upwards, supporting the bullish sentiment.
Momentum Analysis:
- RSI: The Relative Strength Index (RSI) has been in the overbought territory, indicating a strong bullish momentum.
- Stochastic Oscillator: Both %K and %D have been in the overbought zone, signaling a potential reversal or consolidation.
- Williams %R: The Williams %R has been consistently in the oversold region, suggesting a bearish sentiment.
Volatility Analysis:
- Bollinger Bands: The price has been consistently trading above the upper Bollinger Band, indicating an overbought condition.
- Bollinger %B: The %B indicator has been above 0.8, further confirming the overbought status.
- Average True Range (ATR): The ATR has shown an increase in volatility over the past few days.
Volume Analysis:
- On-Balance Volume (OBV): The OBV has been steadily increasing, reflecting strong buying pressure.
- Chaikin Money Flow (CMF): The CMF has been positive, indicating money flow into the stock.
Key Observations:
- The trend indicators suggest a strong bullish sentiment in the short term.
- Momentum indicators show signs of overbought conditions, hinting at a possible reversal or consolidation.
- Volatility has increased, indicating potential price swings.
- Volume indicators support the bullish trend with increasing buying pressure.
Conclusion:
Based on the analysis of the technical indicators, the stock price of EWU is likely to experience further upward movement in the coming days. However, caution is advised as the momentum indicators signal potential overbought conditions, which could lead to a short-term consolidation or pullback. Traders should closely monitor key support and resistance levels to navigate potential price fluctuations.