Technical Analysis of EZA 2024-05-10
Overview:
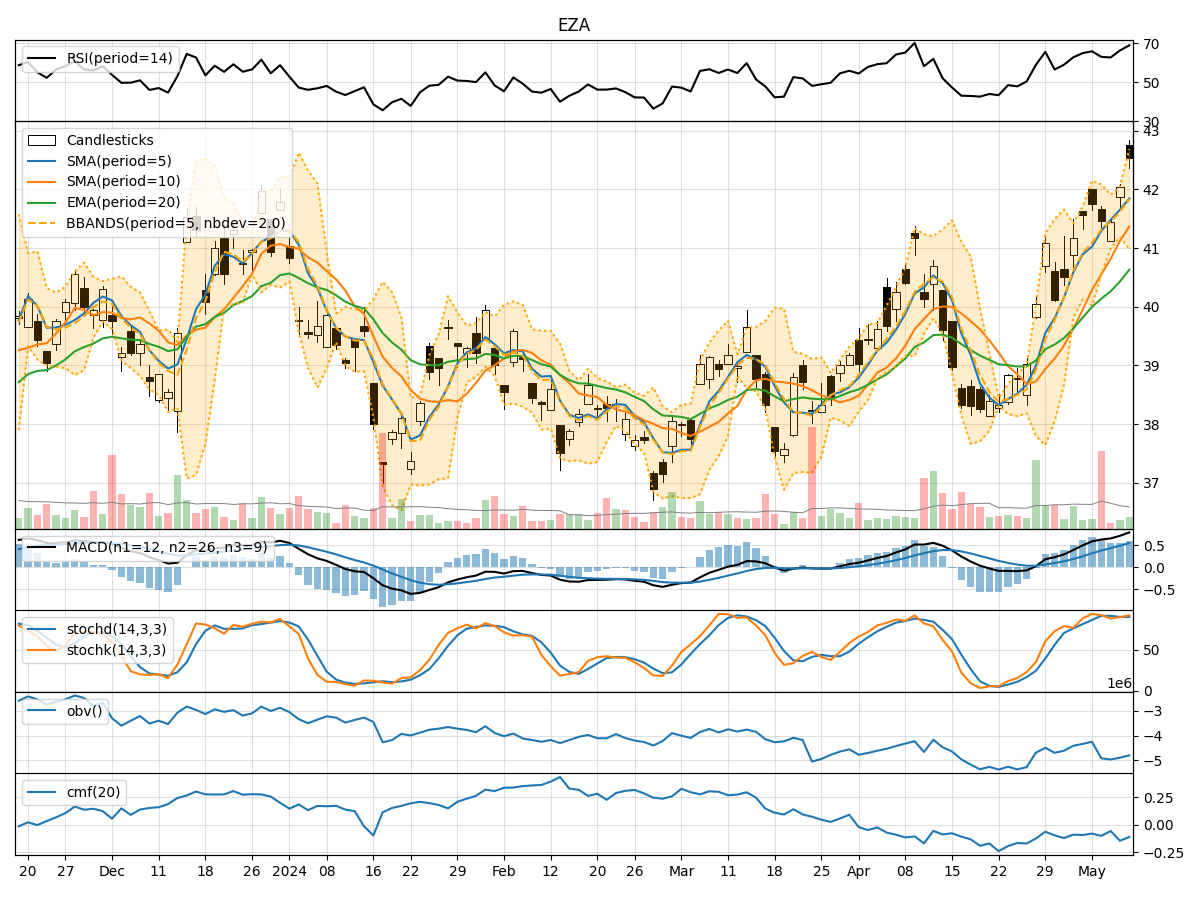
In analyzing the technical indicators for EZA over the last 5 days, we will delve into the trend, momentum, volatility, and volume indicators to provide a comprehensive outlook on the possible stock price movement in the coming days.
Trend Analysis:
- Moving Averages (MA): The 5-day Moving Average (MA) has been consistently above the Simple Moving Average (SMA) and Exponential Moving Average (EMA), indicating a bullish trend.
- MACD: The MACD line has been consistently above the signal line, with both lines showing an upward trend, suggesting bullish momentum.
- MACD Histogram: The MACD Histogram has been increasing, indicating strengthening bullish momentum.
Momentum Analysis:
- RSI: The Relative Strength Index (RSI) has been in the overbought territory, suggesting a potential reversal or consolidation.
- Stochastic Oscillator: Both %K and %D have been in the overbought zone, indicating a potential pullback.
- Williams %R: The Williams %R has been in the oversold region, signaling a possible reversal.
Volatility Analysis:
- Bollinger Bands: The stock price has been trading within the Bollinger Bands, with the bands widening slightly, indicating increased volatility.
- Bollinger %B: The %B indicator has been fluctuating around the midline, suggesting a neutral stance in terms of volatility.
Volume Analysis:
- On-Balance Volume (OBV): The OBV has been declining, indicating selling pressure in the stock.
- Chaikin Money Flow (CMF): The CMF has been negative, suggesting outflow of money from the stock.
Key Observations and Opinions:
- Trend: The trend indicators point towards a strong bullish sentiment in the stock.
- Momentum: The momentum indicators suggest a potential reversal or consolidation due to overbought conditions.
- Volatility: Volatility has slightly increased, but the %B indicator shows a neutral stance.
- Volume: The declining OBV and negative CMF indicate selling pressure and outflow of money from the stock.
Conclusion:
Based on the analysis of the technical indicators, the stock price of EZA is likely to experience a short-term pullback or consolidation in the coming days. The overbought conditions in the momentum indicators and the negative volume indicators suggest a potential reversal in the bullish trend. Traders should exercise caution and consider taking profits or implementing risk management strategies in anticipation of a possible downward movement in the stock price.