Technical Analysis of FCSH 2024-05-10
Overview:
In analyzing the technical indicators for FCSH over the last 5 days, we will delve into the trend, momentum, volatility, and volume indicators to provide a comprehensive outlook on the possible stock price movement in the coming days. By examining these key aspects, we aim to offer valuable insights and predictions for potential investors.
Trend Analysis:
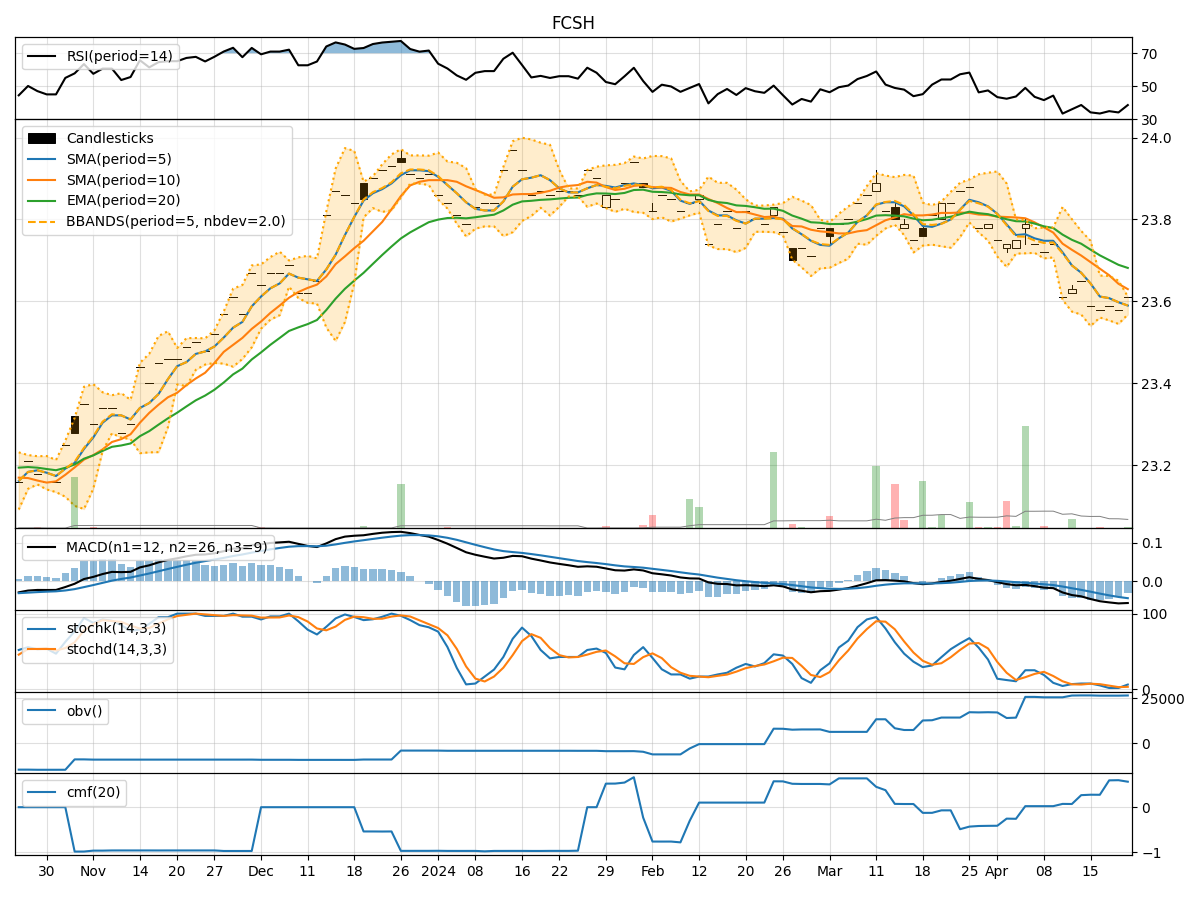
- Moving Averages (MA): The 5-day Moving Average (MA) has been consistently above the Simple Moving Average (SMA) and Exponential Moving Average (EMA), indicating a bullish trend.
- MACD: The Moving Average Convergence Divergence (MACD) and its signal line have been trending upwards, suggesting a strengthening bullish momentum.
- RSI: The Relative Strength Index (RSI) has been fluctuating around the overbought territory, indicating a strong buying pressure.
Momentum Analysis:
- Stochastic Oscillator: Both %K and %D lines of the Stochastic Oscillator have been in the overbought zone, signaling a potential reversal or consolidation.
- Williams %R: The Williams %R has been consistently in the oversold region, indicating a potential buying opportunity.
Volatility Analysis:
- Bollinger Bands (BB): The stock price has been trading within the Bollinger Bands, with the bands narrowing, suggesting a period of low volatility.
- BB% (Bollinger Bands %B): The %B indicator has been hovering around the midline, indicating a balanced market sentiment.
Volume Analysis:
- On-Balance Volume (OBV): The OBV has been relatively stable, suggesting a neutral volume flow.
- Chaikin Money Flow (CMF): The CMF has been positive, indicating a potential inflow of money into the stock.
Conclusion:
Based on the analysis of the technical indicators, the stock of FCSH is currently exhibiting bullish tendencies in terms of trend and momentum. However, the overbought signals from the Stochastic Oscillator and RSI suggest a potential short-term consolidation or pullback in the stock price. The narrowing Bollinger Bands and stable OBV further support the view of a sideways movement in the near future.
Recommendation:
Considering the overall bullish trend but the potential for a short-term consolidation, investors may consider holding their positions or accumulating on dips. It is essential to monitor the Stochastic Oscillator and RSI for signs of a reversal and adjust the strategy accordingly. Additionally, keeping an eye on the volume indicators for any significant changes in buying or selling pressure is crucial for making informed decisions.
In conclusion, while the stock of FCSH shows promise for further upside potential, a cautious approach with proper risk management is advisable in the current market environment.