Technical Analysis of FDIV 2024-05-10
Overview:
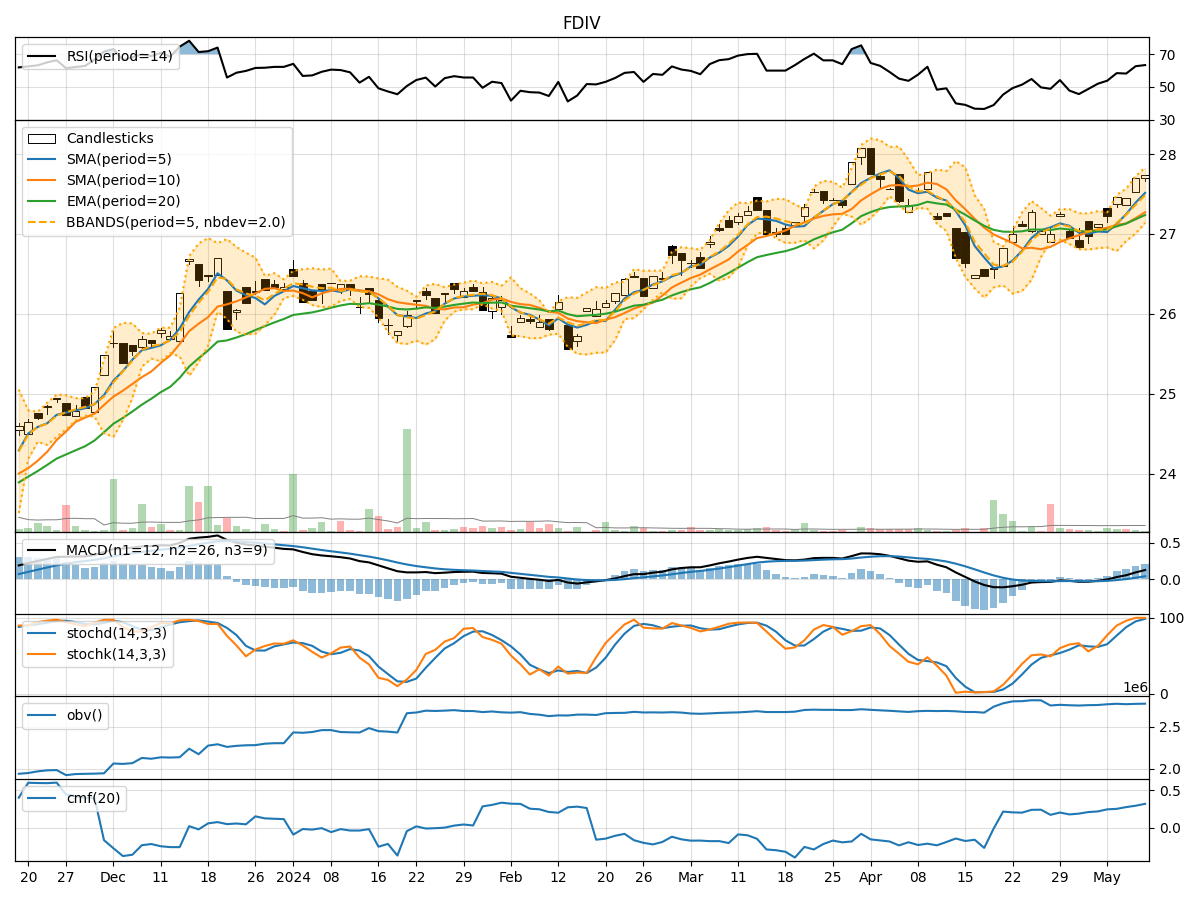
In the last 5 trading days, FDIV stock has shown a consistent uptrend in its price, with increasing volumes. The moving averages and MACD indicators suggest a positive momentum, while the RSI and Stochastic indicators indicate a slightly overbought condition. The Bollinger Bands show a narrowing range, indicating potential consolidation. Overall, the stock appears to be in a bullish phase but may experience a short-term consolidation or pullback.
Trend Indicators Analysis:
- Moving Averages (MA): The 5-day MA has been consistently above the 10-day SMA, indicating a short-term bullish trend.
- MACD: The MACD line has been above the signal line, showing positive momentum.
- MACD Histogram: The histogram has been increasing, indicating strengthening bullish momentum.
Momentum Indicators Analysis:
- RSI: The RSI is in the neutral to slightly overbought territory, suggesting a potential cooling off or consolidation phase.
- Stochastic Oscillator: Both %K and %D are in the overbought zone, signaling a possible reversal or pullback.
- Williams %R: The indicator is at or near the oversold level, indicating a potential reversal to the upside.
Volatility Indicators Analysis:
- Bollinger Bands: The bands have been narrowing, suggesting decreasing volatility and a potential period of consolidation.
- Bollinger %B: The %B is below 1, indicating the price is below the upper band and potentially in a consolidation phase.
Volume Indicators Analysis:
- On-Balance Volume (OBV): The OBV has been steadily increasing, confirming the uptrend in price with rising volumes.
- Chaikin Money Flow (CMF): The CMF is positive, indicating buying pressure and potential further upside.
Key Observations and Opinions:
- The stock is currently in a bullish phase, supported by positive trend and momentum indicators.
- However, the overbought conditions in RSI and Stochastic suggest a potential short-term pullback or consolidation.
- The narrowing Bollinger Bands indicate a period of reduced volatility and possible sideways movement.
- The increasing OBV and positive CMF signal underlying strength in the uptrend.
Conclusion:
Based on the technical indicators and analysis: - Short-Term View: The stock may experience a slight pullback or consolidation in the next few days due to overbought conditions in RSI and Stochastic. - Medium- to Long-Term View: The overall trend remains bullish, supported by positive moving averages, MACD, OBV, and CMF. - Key Recommendation: Consider using any short-term pullback as a buying opportunity for investors with a medium- to long-term horizon.
Overall Assessment:
- Short-Term: Expect a potential pullback or consolidation.
- Medium- to Long-Term: Remain bullish on the stock.
- Action: Consider buying on dips for long-term gains.
By carefully monitoring the indicators and adjusting your strategy accordingly, you can capitalize on potential opportunities while managing risks effectively.