Technical Analysis of FDL 2024-05-10
Overview:
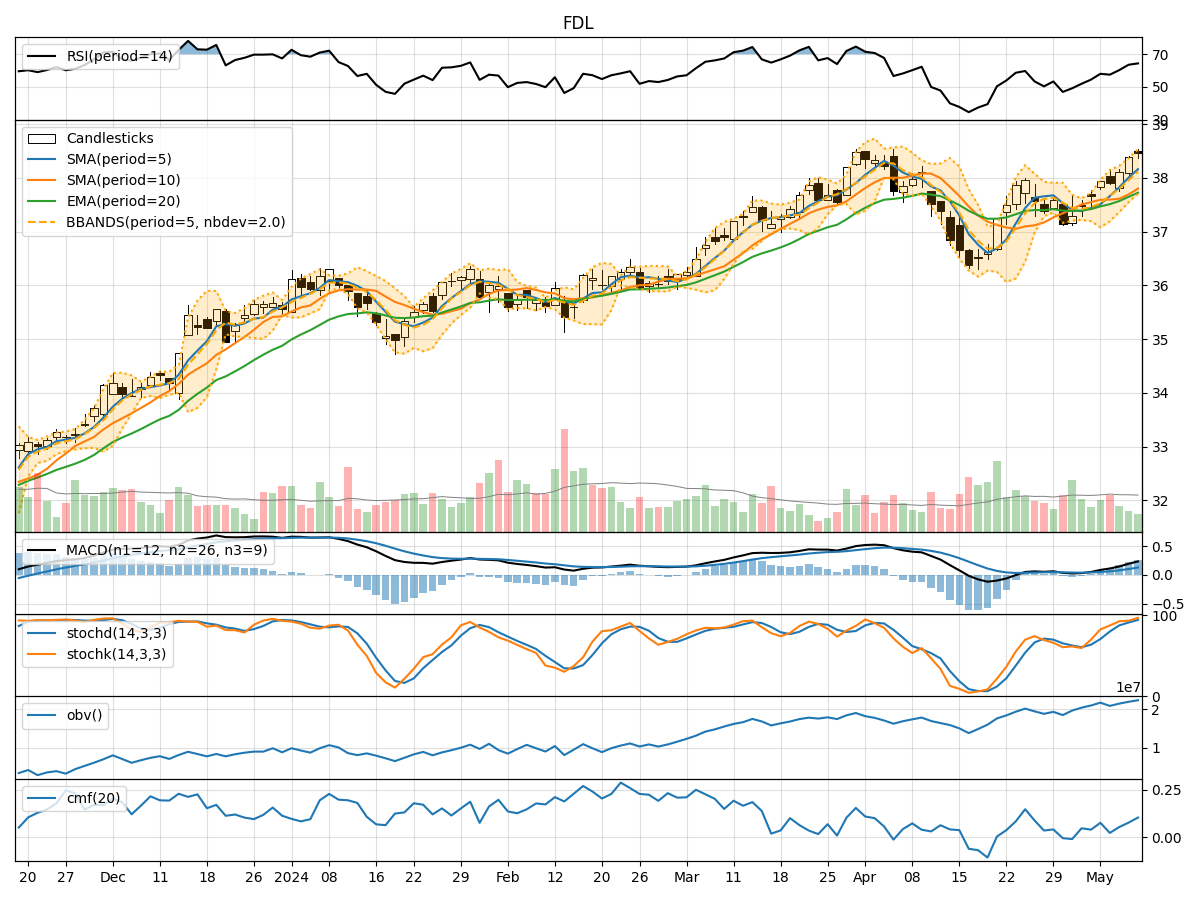
In analyzing the technical indicators for FDL stock over the last 5 days, we will delve into the trend, momentum, volatility, and volume indicators to provide a comprehensive outlook on the possible stock price movement in the coming days.
Trend Analysis:
- Moving Averages (MA): The 5-day Moving Average (MA) has been consistently above the Simple Moving Average (SMA) and Exponential Moving Average (EMA), indicating a bullish trend.
- MACD: The MACD line has been consistently above the signal line, with both lines showing an upward trend, suggesting bullish momentum.
Momentum Analysis:
- RSI: The Relative Strength Index (RSI) has been increasing and is currently in the overbought territory, indicating a strong bullish momentum.
- Stochastic Oscillator: Both %K and %D lines of the Stochastic Oscillator are in the overbought zone, signaling a strong bullish sentiment.
Volatility Analysis:
- Bollinger Bands (BB): The stock price has been consistently trading above the middle Bollinger Band (BBM), indicating an upward trend with low volatility.
Volume Analysis:
- On-Balance Volume (OBV): The OBV has been steadily increasing over the last 5 days, suggesting accumulation by investors.
- Chaikin Money Flow (CMF): The CMF has also been on the rise, indicating buying pressure in the stock.
Key Observations:
- The trend indicators, momentum indicators, and volume indicators all point towards a strong bullish sentiment in the stock.
- The volatility is relatively low, indicating a stable upward trend with limited price fluctuations.
Conclusion:
Based on the analysis of the technical indicators, the next few days' possible stock price movement for FDL is strongly bullish. The stock is likely to continue its upward trajectory, supported by the bullish trend, strong momentum, increasing buying pressure, and low volatility. Traders and investors may consider taking long positions or holding onto existing positions to capitalize on the expected price appreciation.