Technical Analysis of FIDI 2024-05-10
Overview:
In analyzing the technical indicators for FIDI stock over the last 5 days, we will delve into the trend, momentum, volatility, and volume indicators to provide a comprehensive outlook on the possible stock price movement in the coming days. By examining these key indicators, we aim to offer valuable insights and predictions for potential investors.
Trend Indicators:
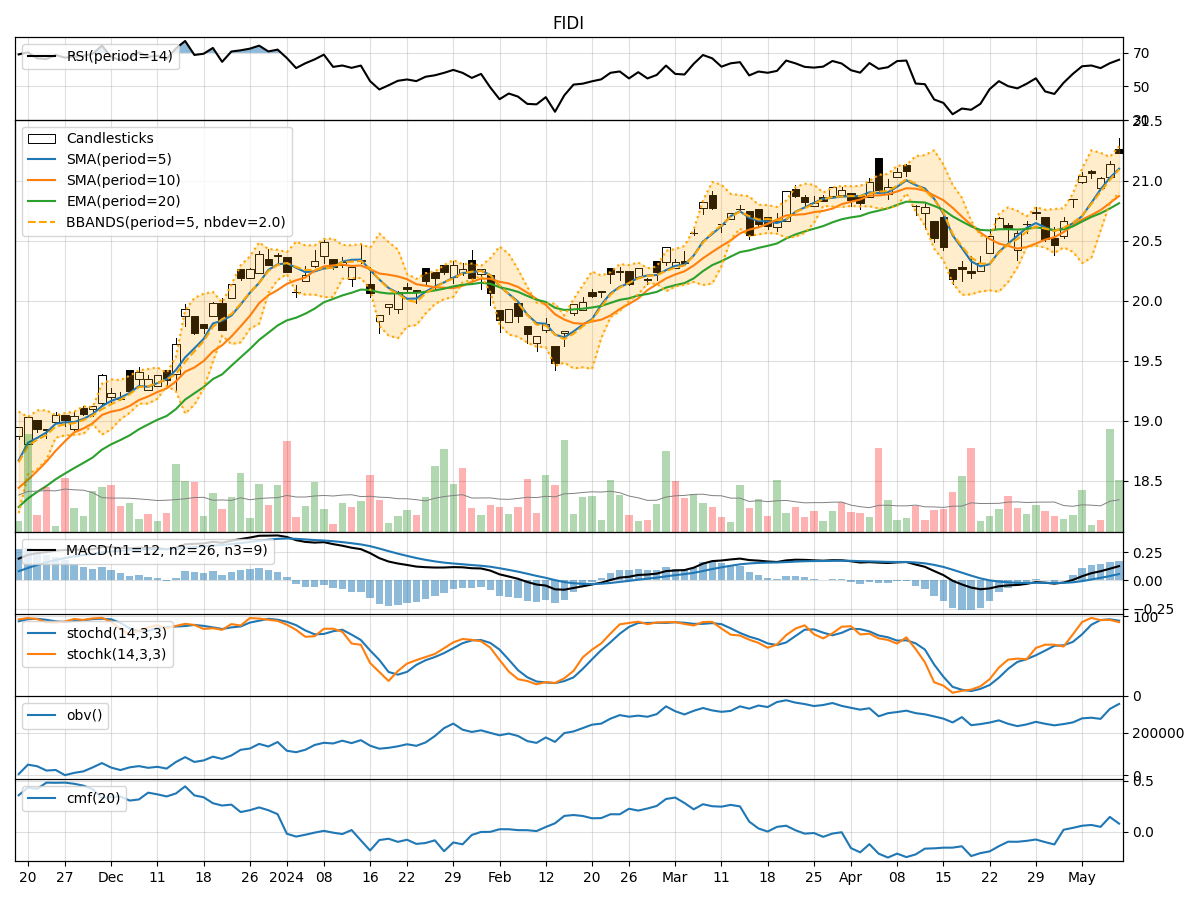
- Moving Averages (MA): The 5-day Moving Average (MA) has been consistently above the Simple Moving Average (SMA) and Exponential Moving Average (EMA), indicating a bullish trend.
- MACD: The MACD line has been consistently above the signal line, with both lines showing an upward trend, suggesting bullish momentum.
- MACD Histogram: The MACD Histogram has been increasing over the past 5 days, indicating strengthening bullish momentum.
Momentum Indicators:
- RSI: The Relative Strength Index (RSI) has been in the range of 60-70, indicating a moderate bullish momentum.
- Stochastic Oscillator: Both %K and %D lines of the Stochastic Oscillator have been fluctuating in the overbought zone, suggesting a potential reversal or consolidation.
- Williams %R: The Williams %R has been consistently in the oversold territory, indicating a potential buying opportunity.
Volatility Indicators:
- Bollinger Bands (BB): The stock price has been trading within the Bollinger Bands, with the bands widening slightly, indicating increased volatility.
- Bollinger %B: The %B indicator has been fluctuating around 0.8, suggesting the stock is trading near the upper band.
- Average True Range (ATR): The ATR has shown a slight increase, indicating a rise in volatility.
Volume Indicators:
- On-Balance Volume (OBV): The OBV has been increasing over the past 5 days, indicating accumulation by investors.
- Chaikin Money Flow (CMF): The CMF has been positive but relatively flat, suggesting a neutral sentiment towards the stock.
Key Observations:
- The trend indicators suggest a strong bullish sentiment, supported by the MACD and moving averages.
- Momentum indicators show a mixed signal with RSI indicating moderate bullish momentum and Stochastic Oscillator signaling a potential reversal.
- Volatility indicators point towards increased volatility, as seen in the widening Bollinger Bands and rising ATR.
- Volume indicators indicate accumulation by investors, although the CMF reflects a neutral sentiment.
Conclusion:
Based on the analysis of the technical indicators, the stock is likely to experience a continuation of the bullish trend in the short term. However, caution is advised as the Stochastic Oscillator signals a potential reversal, and the increased volatility could lead to sudden price swings. Investors should closely monitor the price action and key support/resistance levels to make informed trading decisions.