Technical Analysis of FLDR 2024-05-10
Overview:
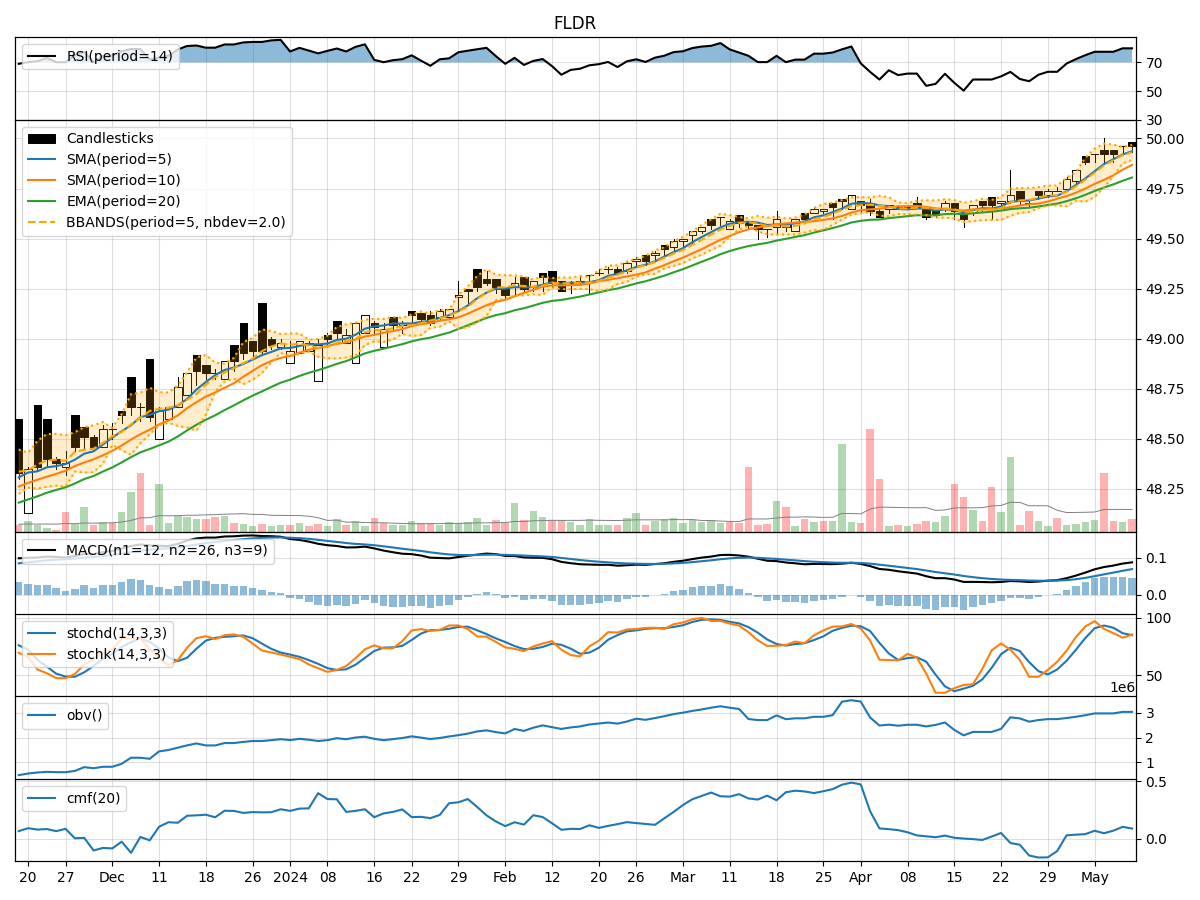
In analyzing the technical indicators for FLDR over the last 5 days, we will delve into the trend, momentum, volatility, and volume indicators to provide a comprehensive outlook on the possible stock price movement in the coming days. By examining these key indicators, we aim to offer valuable insights and predictions for potential investors.
Trend Indicators:
- Moving Averages (MA): The 5-day MA has been consistently above the closing price, indicating a bullish trend.
- MACD: The MACD line has been trending upwards, with the MACD histogram also showing positive values, suggesting bullish momentum.
- EMA: The exponential moving average has been steadily increasing, supporting the bullish trend.
Momentum Indicators:
- RSI: The RSI has been in the overbought territory, indicating strong buying momentum.
- Stochastic Oscillator: Both %K and %D have been relatively high, suggesting bullish momentum.
- Williams %R: The indicator has been hovering near oversold levels, indicating potential buying opportunities.
Volatility Indicators:
- Bollinger Bands: The stock price has been trading within the bands, indicating stable volatility.
- Bollinger %B: The %B value has been fluctuating within a moderate range, suggesting stable price movements.
Volume Indicators:
- On-Balance Volume (OBV): The OBV has been increasing, indicating accumulation by investors.
- Chaikin Money Flow (CMF): The CMF has been positive, suggesting buying pressure in the stock.
Key Observations:
- The trend indicators point towards a bullish sentiment, supported by the moving averages and MACD.
- Momentum indicators indicate strong buying momentum, with RSI in the overbought zone.
- Volatility remains stable, as indicated by Bollinger Bands.
- Volume indicators show accumulation and buying pressure in the stock.
Conclusion:
Based on the analysis of the technical indicators, the stock is likely to continue its upward trend in the coming days. The bullish sentiment is supported by the moving averages, MACD, RSI, and positive volume indicators. Investors may consider buying or holding positions in FLDR as the stock shows signs of further upside potential. It is important to monitor the indicators closely for any signs of reversal or consolidation in the future.