Technical Analysis of FLGB 2024-05-10
Overview:
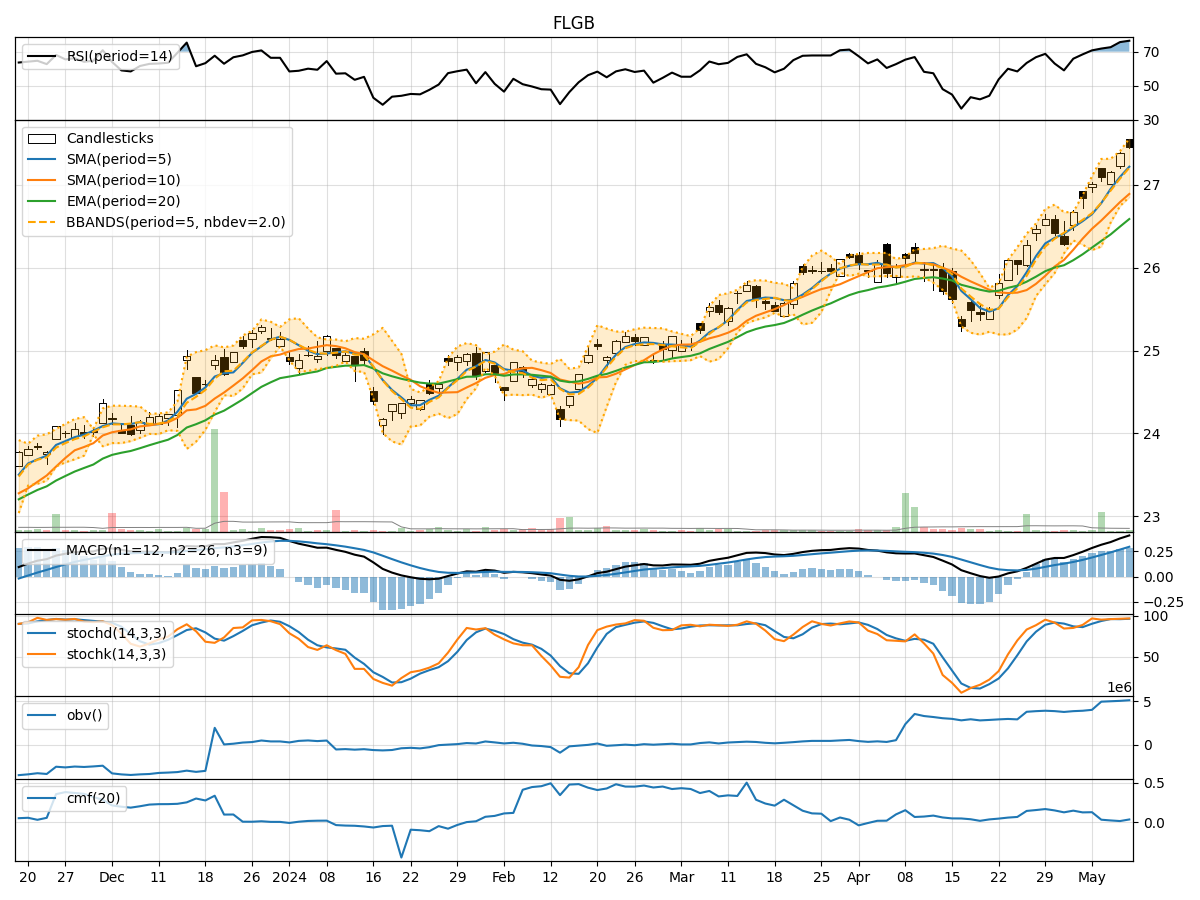
In analyzing the technical indicators for FLGB over the last 5 days, we will delve into the trend, momentum, volatility, and volume indicators to provide a comprehensive outlook on the possible stock price movement in the coming days.
Trend Indicators:
- Moving Averages (MA): The 5-day Moving Average has been consistently above the longer-term Simple Moving Average (SMA) and Exponential Moving Average (EMA), indicating a bullish trend.
- MACD: The MACD line has been consistently above the signal line, with both lines showing an upward trend, suggesting bullish momentum.
- MACD Histogram: The MACD Histogram has been increasing over the past 5 days, indicating strengthening bullish momentum.
Momentum Indicators:
- RSI: The Relative Strength Index (RSI) has been in the overbought territory, indicating a strong bullish momentum.
- Stochastic Oscillator: Both %K and %D lines of the Stochastic Oscillator have been in the overbought zone, suggesting a potential reversal or consolidation.
- Williams %R: The Williams %R has been fluctuating in the oversold territory, indicating potential buying opportunities.
Volatility Indicators:
- Bollinger Bands: The stock price has been trading within the Bollinger Bands, with the bands widening slightly, indicating increased volatility.
- Bollinger %B: The %B indicator has been fluctuating around 0.8, suggesting the stock is trading near the upper band.
Volume Indicators:
- On-Balance Volume (OBV): The OBV has been steadily increasing over the last 5 days, indicating strong buying pressure.
- Chaikin Money Flow (CMF): The CMF has been positive but decreasing slightly, suggesting a potential decrease in buying pressure.
Key Observations and Opinions:
- Trend: The trend indicators suggest a strong bullish trend in the stock.
- Momentum: The momentum indicators indicate a high level of bullish momentum, but some indicators are in the overbought zone, signaling a potential reversal or consolidation.
- Volatility: Volatility has slightly increased, which could lead to larger price swings.
- Volume: The increasing OBV indicates strong buying interest, but the slight decrease in CMF suggests a potential slowdown in buying pressure.
Conclusion:
Based on the analysis of the technical indicators, the stock FLGB is currently in a strong bullish trend with high bullish momentum. However, the overbought conditions in some momentum indicators and the potential decrease in buying pressure indicated by CMF suggest a possible consolidation or minor pullback in the coming days. Traders should monitor the price action closely for signs of a reversal or continuation of the bullish trend.