Technical Analysis of FLIA 2024-05-10
Overview:
In analyzing the technical indicators for FLIA stock over the last 5 days, we will delve into the trend, momentum, volatility, and volume indicators to provide a comprehensive outlook on the possible stock price movement in the coming days. By examining these key indicators, we aim to offer valuable insights and predictions for potential investors.
Trend Indicators:
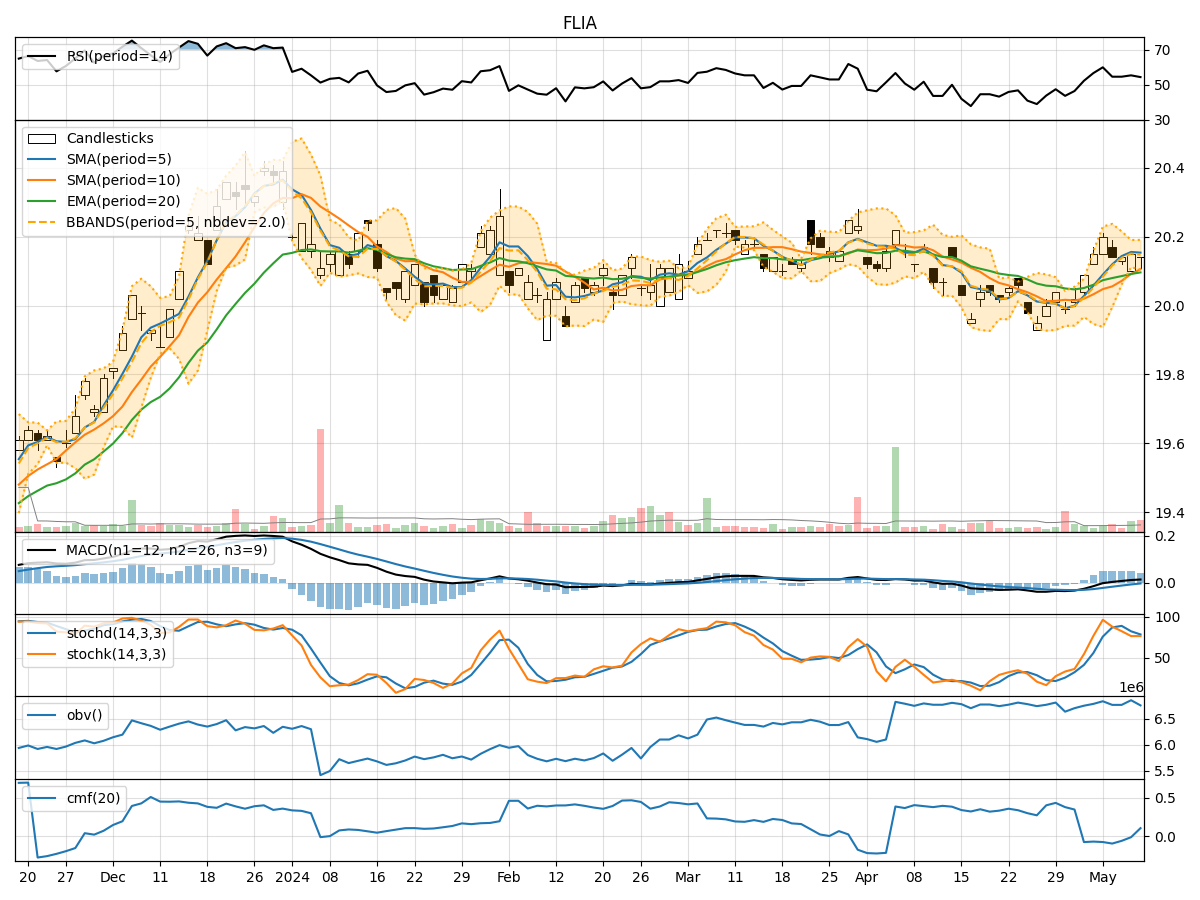
- Moving Averages (MA): The 5-day Moving Average (MA) has been consistently above the Simple Moving Average (SMA) and Exponential Moving Average (EMA), indicating a short-term uptrend.
- MACD: The MACD line has been consistently above the signal line, with both lines showing an upward trend, suggesting bullish momentum.
- MACD Histogram: The MACD Histogram has been increasing over the past few days, indicating strengthening bullish momentum.
Momentum Indicators:
- RSI: The Relative Strength Index (RSI) has been fluctuating around the 50 level, indicating a neutral momentum with no clear overbought or oversold conditions.
- Stochastic Oscillator: Both %K and %D lines of the Stochastic Oscillator have been hovering in the neutral zone, suggesting a lack of strong directional momentum.
- Williams %R: The Williams %R indicator has been consistently in the oversold territory, indicating a potential reversal or buying opportunity.
Volatility Indicators:
- Bollinger Bands: The Bollinger Bands have been relatively narrow, indicating low volatility in the stock price movement.
- Bollinger %B: The %B indicator has been fluctuating around the midline, suggesting a lack of strong trend direction.
- Average True Range (ATR): The ATR value has been relatively low, indicating stable price movement without significant fluctuations.
Volume Indicators:
- On-Balance Volume (OBV): The OBV indicator has been fluctuating, indicating mixed buying and selling pressure in the stock.
- Chaikin Money Flow (CMF): The CMF has been negative, suggesting a net outflow of money from the stock over the past few days.
Conclusion:
Based on the analysis of the technical indicators, the stock of FLIA is currently exhibiting a sideways trend with neutral momentum and low volatility. The lack of clear direction in the trend and momentum indicators, coupled with low volatility and mixed volume signals, suggests that the stock is likely to continue trading within a narrow range in the coming days. Investors may expect consolidation or sideways movement in the stock price until there is a significant catalyst to drive a clear trend. It is advisable to closely monitor key support and resistance levels for potential breakout or breakdown scenarios.
In conclusion, the overall outlook for FLIA stock in the next few days is neutral with a bias towards sideways movement. Investors should exercise caution and wait for clearer signals before making significant trading decisions.