Technical Analysis of FLOT 2024-05-10
Overview:
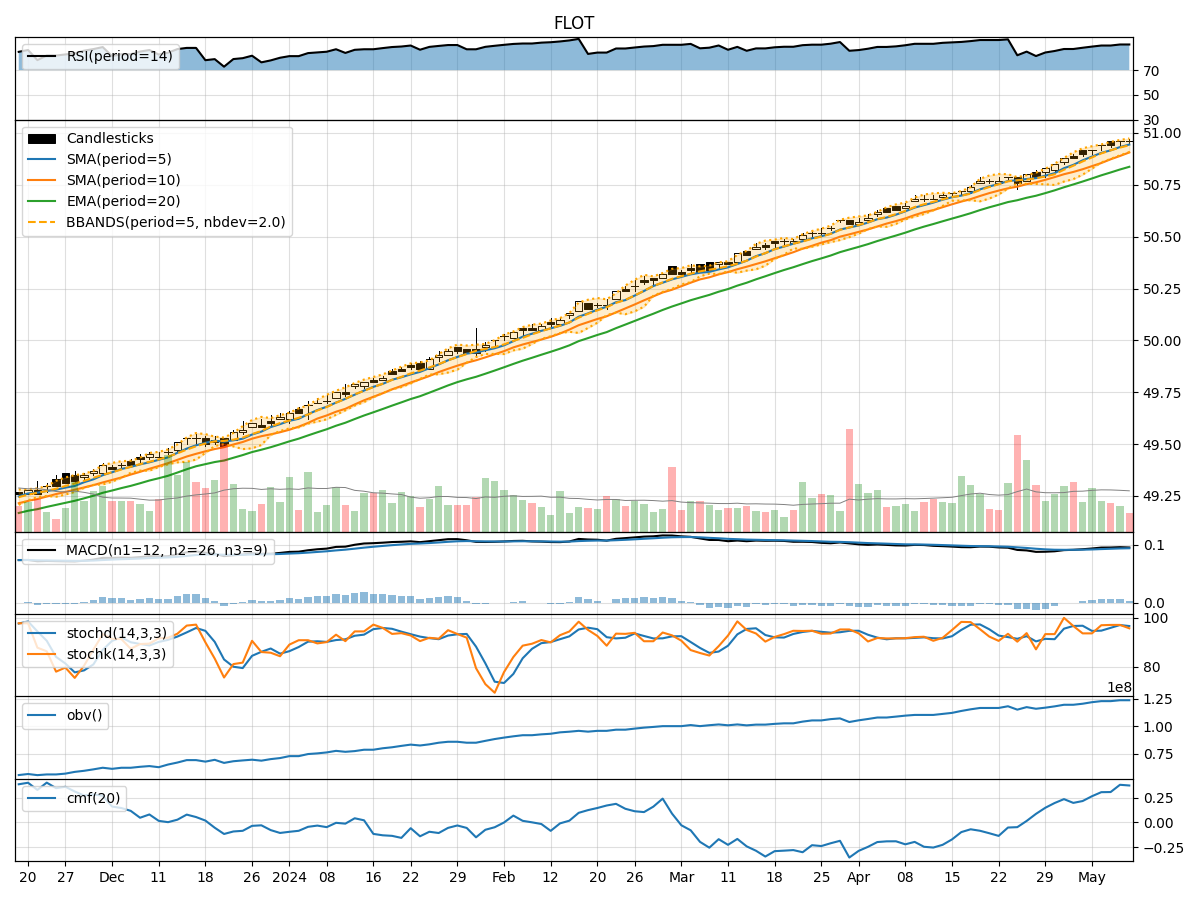
In analyzing the technical indicators for FLOT over the last 5 days, we will delve into the trend, momentum, volatility, and volume indicators to provide a comprehensive outlook on the possible stock price movement in the coming days.
Trend Analysis:
- Moving Averages (MA): The 5-day MA has been consistently above the closing price, indicating a short-term uptrend.
- MACD: The MACD line has been positive, suggesting bullish momentum.
- EMA: The EMA has been trending upwards, supporting the bullish sentiment.
Momentum Analysis:
- RSI: The RSI has been in the overbought territory, indicating strong buying momentum.
- Stochastic Oscillator: Both %K and %D have been high, signaling potential overbought conditions.
- Williams %R: The indicator has been in the oversold region, suggesting a possible reversal.
Volatility Analysis:
- Bollinger Bands (BB): The bands have been narrowing, indicating decreasing volatility.
- BB %B: The %B has been fluctuating within a range, suggesting consolidation.
- BB Width: The width of the bands has been decreasing, indicating reduced price fluctuations.
Volume Analysis:
- On-Balance Volume (OBV): The OBV has been increasing, reflecting accumulation by investors.
- Chaikin Money Flow (CMF): The CMF has been positive, indicating buying pressure.
Key Observations:
- The trend indicators suggest a bullish bias with positive moving averages and MACD.
- Momentum indicators show mixed signals with overbought RSI and stochastic, but oversold Williams %R.
- Volatility indicators point towards decreasing volatility and potential consolidation.
- Volume indicators indicate accumulation and positive money flow into the stock.
Conclusion:
Based on the analysis of the technical indicators, the stock is likely to experience a period of consolidation in the coming days. The bullish trend may pause as momentum indicators show conflicting signals, and volatility is decreasing. Investors should monitor the price action closely for a potential breakout or reversal. Overall, the outlook is neutral with a slight bias towards consolidation.